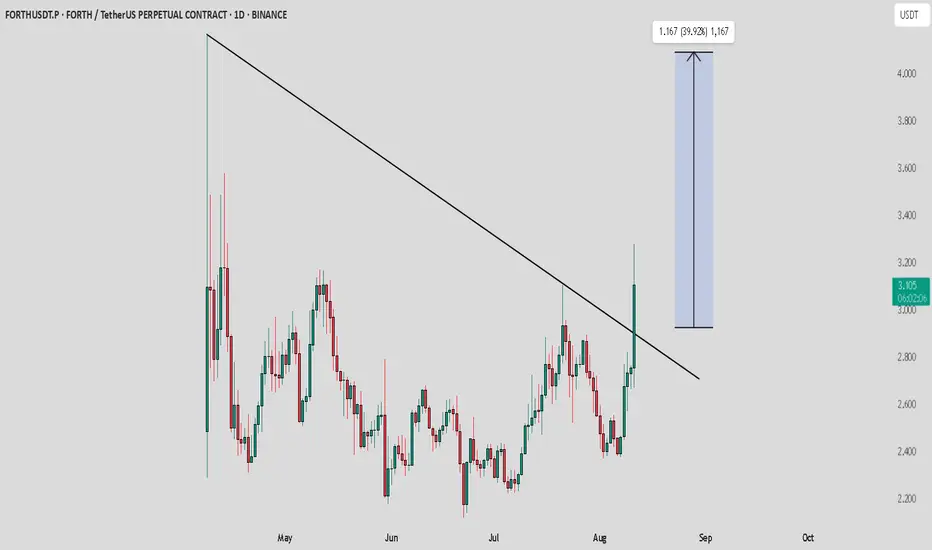
FORTH has successfully broken out of a multi-month descending triangle pattern on the daily chart. This breakout is a significant development, as the price had been consolidating and forming lower highs since May.
The recent strong bullish candle has closed above the upper trendline of the triangle, confirming the breakout. The measured move target for this pattern is indicated on the chart, pointing towards a potential price target of around $4.10.
Key Points:
* Breakout Confirmed: The daily close above the descending trendline validates the bullish move.
* Target: The measured move suggests a potential target of $4.10, which would represent a substantial gain from the current level.
* Support: The previous resistance trendline should now act as a support level. Any retest of this line could be seen as a buying opportunity.
This breakout indicates a potential shift in momentum from bearish consolidation to a new bullish trend.
🚀 Join my Telegram community for free crypto signals, entry/exit points, and real-time market updates!
👉t.me/CryptoPrime18
👉t.me/CryptoPrime18
Disclaimer
The information and publications are not meant to be, and do not constitute, financial, investment, trading, or other types of advice or recommendations supplied or endorsed by TradingView. Read more in the Terms of Use.