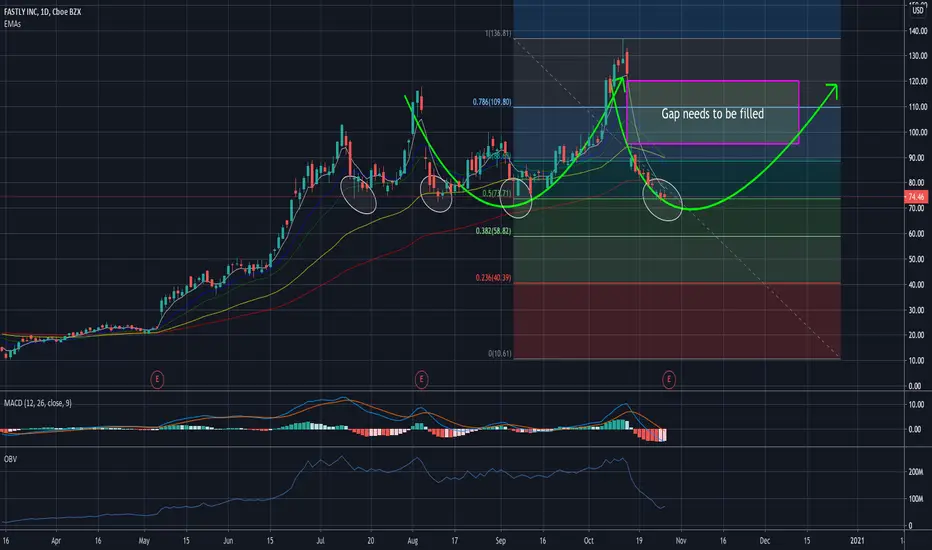
The chart is indicating a quad bottom support around $74 and some buyers have showed up to defend this critical support. The upside is the gap fill all the way up to $120. Good risk/reward opportunity with tight stop losses.
Note
Moved with the market today - on watch to determine if this is a start of a new trend or a bear flag. RSI indicates oversold - could be a swing back upwards.Note
Scaled more into Long position.Note
Added more long shares and contracts.Disclaimer
The information and publications are not meant to be, and do not constitute, financial, investment, trading, or other types of advice or recommendations supplied or endorsed by TradingView. Read more in the Terms of Use.
Disclaimer
The information and publications are not meant to be, and do not constitute, financial, investment, trading, or other types of advice or recommendations supplied or endorsed by TradingView. Read more in the Terms of Use.