Published by: Wavervanir_International_LLC
Ticker: FSLY
FSLY
Timeframe: 1D
Bias: Moderately Bullish – Liquidity Hunt Confirmed
Strategy: Smart Money Concepts (SMC) + Fibonacci Confluence + Volume + ORB Break
📌 Technical Outlook:
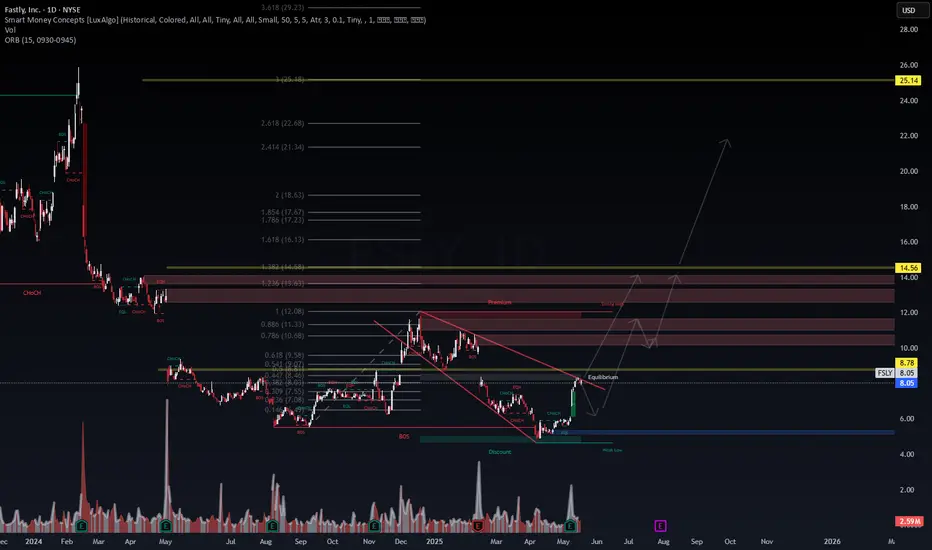
Fastly, Inc. (FSLY) is showing signs of institutional accumulation after multiple CHoCHs and a decisive Break of Structure (BOS) from the recent downtrend. The price has exited a descending wedge pattern and is now approaching the equilibrium zone (~$8.78)—a key inflection point between premium and discount pricing.
Volume confirmation suggests a change in participation behavior.
Multiple internal CHoCHs and BOS suggest a bullish internal structure.
The prior discount zone (around $5.00) was swept with conviction.
📍 Critical Zones:
Equilibrium Resistance: $8.78
Fibonacci Premium Zone: $10.68 to $13.63
Final Liquidity Target: $14.56
Discount Demand Zone: $4.90 – $5.50 (Reaccumulation area)
📈 Scenario 1 – Breakout & Continuation:
If price holds above $8.78, expect a potential move toward the premium imbalance zone and liquidity pockets around $12–14.50. Bullish continuation may follow a retest of the current breakout structure.
📉 Scenario 2 – Reject & Reaccumulate:
Failure to sustain above equilibrium may lead to a short-term pullback into the discount range (~$6.20–$5.00) for another round of accumulation before a stronger bullish leg initiates.
Outlook: Favoring bullish continuation with flexible bias.
Trigger: Break and retest of the $8.78 zone on volume.
Invalidation: Clean breakdown and failure to reclaim $6.20 structure.
📊 Institutional-grade liquidity mapping and price behavior confirm high-probability setups ahead. Adaptability remains key in a two-path scenario structure.
Follow for more data-driven SMC analysis and hedge-fund-grade modeling.
— Wavervanir_International_LLC
#SMC #FSLY #LiquidityMap #SmartMoney #TradingView #VolumeProfile #EquilibriumTheory #TechnicalAnalysis
Ticker:
Timeframe: 1D
Bias: Moderately Bullish – Liquidity Hunt Confirmed
Strategy: Smart Money Concepts (SMC) + Fibonacci Confluence + Volume + ORB Break
📌 Technical Outlook:
Fastly, Inc. (
Volume confirmation suggests a change in participation behavior.
Multiple internal CHoCHs and BOS suggest a bullish internal structure.
The prior discount zone (around $5.00) was swept with conviction.
📍 Critical Zones:
Equilibrium Resistance: $8.78
Fibonacci Premium Zone: $10.68 to $13.63
Final Liquidity Target: $14.56
Discount Demand Zone: $4.90 – $5.50 (Reaccumulation area)
📈 Scenario 1 – Breakout & Continuation:
If price holds above $8.78, expect a potential move toward the premium imbalance zone and liquidity pockets around $12–14.50. Bullish continuation may follow a retest of the current breakout structure.
📉 Scenario 2 – Reject & Reaccumulate:
Failure to sustain above equilibrium may lead to a short-term pullback into the discount range (~$6.20–$5.00) for another round of accumulation before a stronger bullish leg initiates.
Outlook: Favoring bullish continuation with flexible bias.
Trigger: Break and retest of the $8.78 zone on volume.
Invalidation: Clean breakdown and failure to reclaim $6.20 structure.
📊 Institutional-grade liquidity mapping and price behavior confirm high-probability setups ahead. Adaptability remains key in a two-path scenario structure.
Follow for more data-driven SMC analysis and hedge-fund-grade modeling.
— Wavervanir_International_LLC
#SMC #FSLY #LiquidityMap #SmartMoney #TradingView #VolumeProfile #EquilibriumTheory #TechnicalAnalysis
Note
Disclaimer
The information and publications are not meant to be, and do not constitute, financial, investment, trading, or other types of advice or recommendations supplied or endorsed by TradingView. Read more in the Terms of Use.
Disclaimer
The information and publications are not meant to be, and do not constitute, financial, investment, trading, or other types of advice or recommendations supplied or endorsed by TradingView. Read more in the Terms of Use.