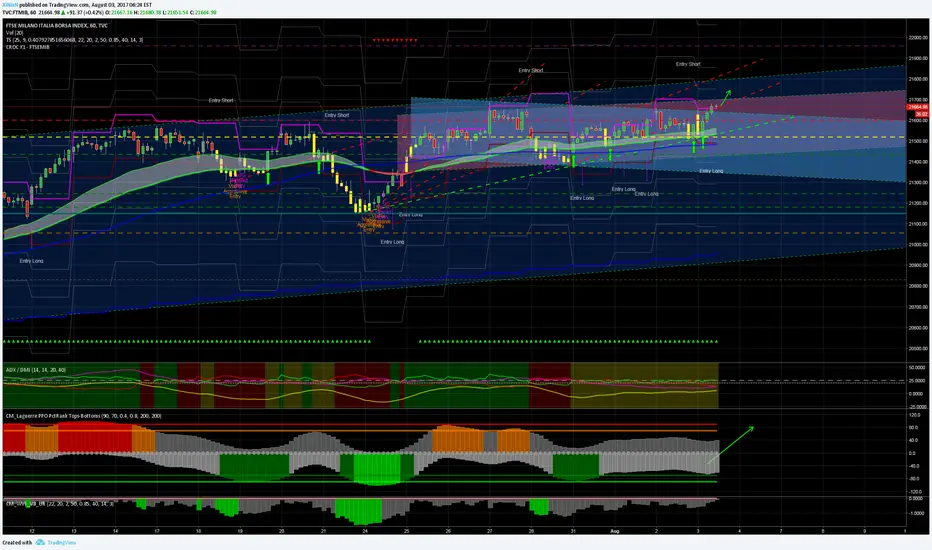
FTSEMIB Index- ADX / ADM - TS V. 2.9.1 - Intraday Levels for 03/08/2017
ADM - Average Daily Movement - Intraday Levels
Entry on close 1H (hourly candle) ... if exceeded the indicated level
LONG if > 21657.91 [Gain%]
TP1 = 21750.91 [0.4%]
TP2 = 21841.84 [0.8%]
TP3 = 22027.84 [1.7%]
Stop Loss = 21489.31 [-0.8%]
SHORT if <21489,310 [Gain%]
TP1 = 21,396,310 [-0.4%]
TP2 = 21,305,380 [-0.9%]
TP3 = 21,119,380 [-1,7%]
Stop Loss = 21,657,910 [0.8%]
"On my blog, find the detailed explanation of how these levels works"
Disclaimer
The information and publications are not meant to be, and do not constitute, financial, investment, trading, or other types of advice or recommendations supplied or endorsed by TradingView. Read more in the Terms of Use.
Disclaimer
The information and publications are not meant to be, and do not constitute, financial, investment, trading, or other types of advice or recommendations supplied or endorsed by TradingView. Read more in the Terms of Use.
