Long
FTM - Bearish Divergence 🧐
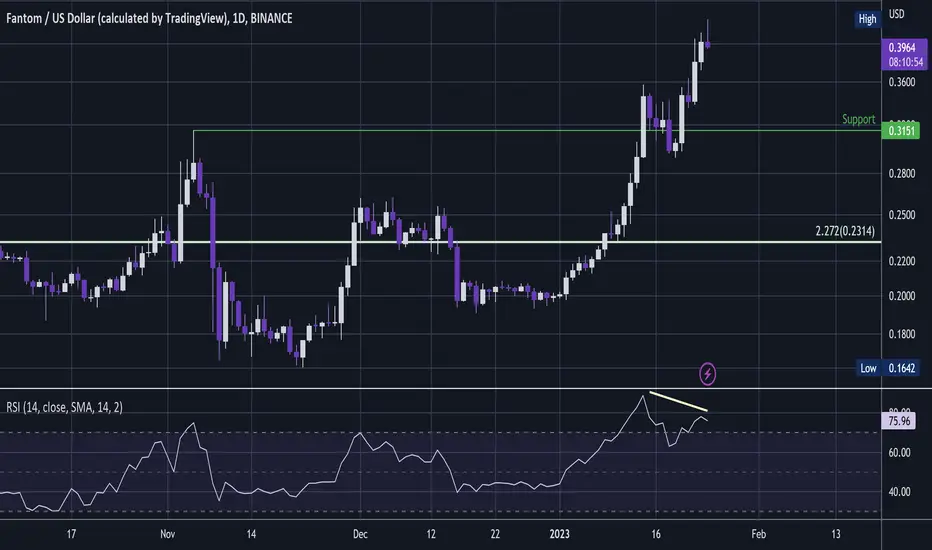
This coin is showing all the life signs of being a real big hitter potentially at the start of a bull run.
But short term the daily RSI is showing bearish divergence and so we'll be looking for it to drop off a bit, perhaps to around 50-60 or at support depending on whether it is a or a continuation pattern pattern sharp correction .
That said FOMC meeting will be next week and along with debt ceiling issues there may be some turbulence, so we'll see. If BTC gets rocked then this may go lower so not looking to rush in as there may be discounts in the pipeline.
Overall this looks very bullish but there are some potential bumps in the road.
Not advice.
Note
Don't forget to check my first BTC video - linked below 👍🏻.Note
TV is too atomised for me to remember to update all my threads these days, but as I suggested the 50-60 RSI range was a prefect entry point - it found a low at 47.Your FA guru can't read a chart💭
I run a technical group with lots of content every day + regular videos, 1:1, chatroom 🚀.
Better than all the rest? My record speaks for itself 💡.
Telegram Group: $50 per month✨.
Contact: t.me/dRends35
I run a technical group with lots of content every day + regular videos, 1:1, chatroom 🚀.
Better than all the rest? My record speaks for itself 💡.
Telegram Group: $50 per month✨.
Contact: t.me/dRends35
Related publications
Disclaimer
The information and publications are not meant to be, and do not constitute, financial, investment, trading, or other types of advice or recommendations supplied or endorsed by TradingView. Read more in the Terms of Use.
Your FA guru can't read a chart💭
I run a technical group with lots of content every day + regular videos, 1:1, chatroom 🚀.
Better than all the rest? My record speaks for itself 💡.
Telegram Group: $50 per month✨.
Contact: t.me/dRends35
I run a technical group with lots of content every day + regular videos, 1:1, chatroom 🚀.
Better than all the rest? My record speaks for itself 💡.
Telegram Group: $50 per month✨.
Contact: t.me/dRends35
Related publications
Disclaimer
The information and publications are not meant to be, and do not constitute, financial, investment, trading, or other types of advice or recommendations supplied or endorsed by TradingView. Read more in the Terms of Use.