Short
Fantom (FTM) - macro bearish divergence
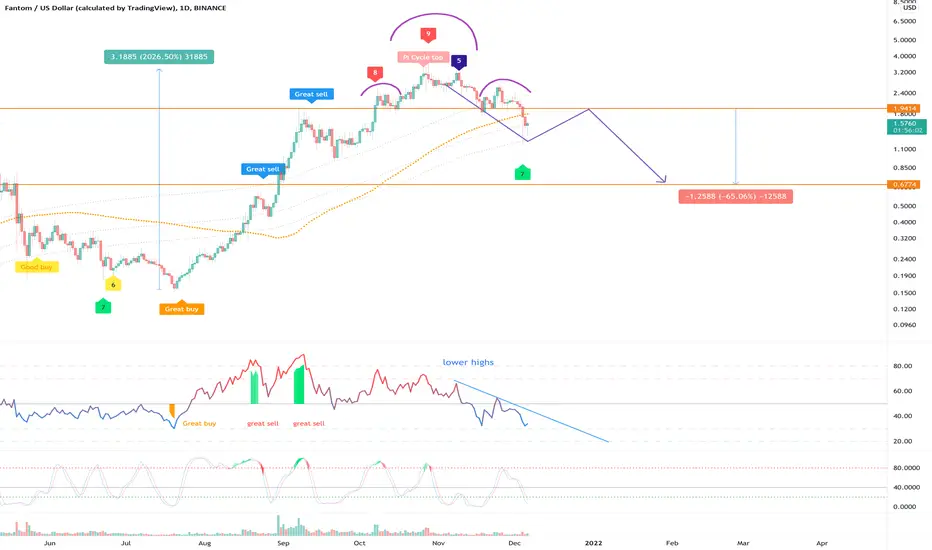
On the above 1-day chart price action has appreciated by 2000% in less than 6 months! Astonishing. A number of reasons now exist to be bearish, including:
1) The confirmed bearish head and shoulders pattern with neckline break. Expect a back test.
2) The ‘pi cycle top’ alert.
3) Numerous oscillators are printing bearish divergence with price action.
4) Lastly on the weekly chart (below) price action prints a significant bearish divergence between price action and the RSI.
Is it possible price action prints a new all time high? Sure.
Is it probable? No.
Trade is void with a break of $3.20.
Good luck!
WW
weekly bearish divergence
Trade closed: target reached
85% correction. Price actin actually dropped past target.Strong buy signal is now printing with price action on the golden ratio.
Note
March 2023 might offer a good long opportunity BTC
bc1q2eckdzh0q8vsd7swcc8et6ze7s99khhxyl7zwy
Weblink: patreon.com/withoutworries
Allow 3-6 months on ideas. Not investment advice. DYOR
bc1q2eckdzh0q8vsd7swcc8et6ze7s99khhxyl7zwy
Weblink: patreon.com/withoutworries
Allow 3-6 months on ideas. Not investment advice. DYOR
Disclaimer
The information and publications are not meant to be, and do not constitute, financial, investment, trading, or other types of advice or recommendations supplied or endorsed by TradingView. Read more in the Terms of Use.
BTC
bc1q2eckdzh0q8vsd7swcc8et6ze7s99khhxyl7zwy
Weblink: patreon.com/withoutworries
Allow 3-6 months on ideas. Not investment advice. DYOR
bc1q2eckdzh0q8vsd7swcc8et6ze7s99khhxyl7zwy
Weblink: patreon.com/withoutworries
Allow 3-6 months on ideas. Not investment advice. DYOR
Disclaimer
The information and publications are not meant to be, and do not constitute, financial, investment, trading, or other types of advice or recommendations supplied or endorsed by TradingView. Read more in the Terms of Use.