Long
FTMUSD ❕ under the resistance zone
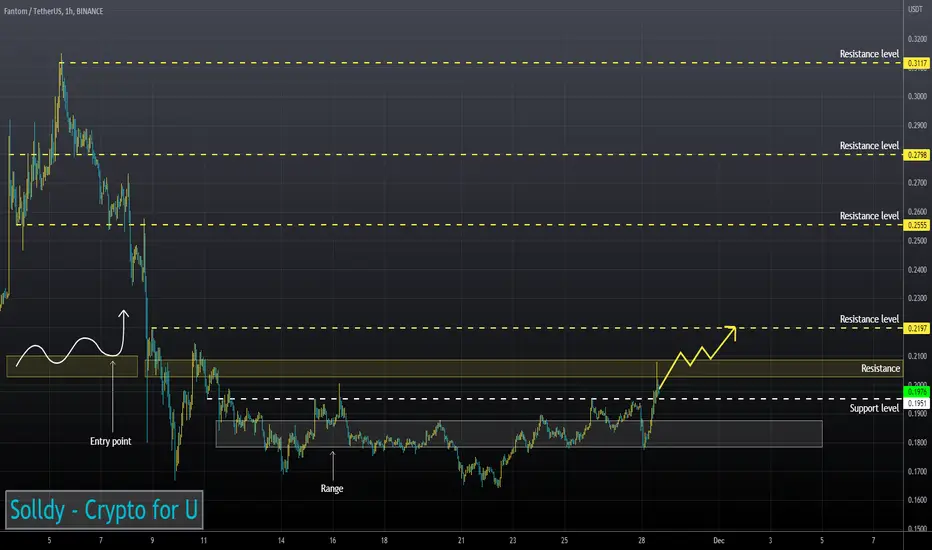
RSI chart is in the bullish zone (4H, 1H and 30m TF)
Price is testing 200EMA as resistance (4H TF)
Fantom has already broken through the recently successful resistance zone.
If the asset quickly and successfully breaks through the mentioned resistance zone, I expect further price growth.
Price is testing 200EMA as resistance (4H TF)
Fantom has already broken through the recently successful resistance zone.
If the asset quickly and successfully breaks through the mentioned resistance zone, I expect further price growth.
Related publications
Disclaimer
The information and publications are not meant to be, and do not constitute, financial, investment, trading, or other types of advice or recommendations supplied or endorsed by TradingView. Read more in the Terms of Use.
Related publications
Disclaimer
The information and publications are not meant to be, and do not constitute, financial, investment, trading, or other types of advice or recommendations supplied or endorsed by TradingView. Read more in the Terms of Use.