Long
FTMUSDT
Hello Crypto Lovers,
Mars Signals team wishes you high profits.
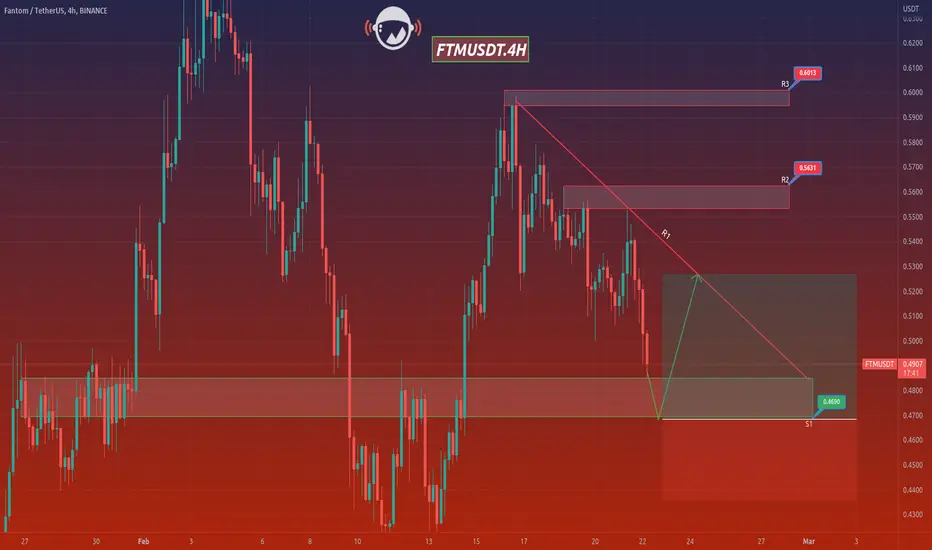
This is a 4-hour-time frame analysis for FTMUSDT
In this chart, R3, R2, and R1 are our resistance areas in which the unsuccessful triumphs of price is clearly seen. And at the bottom of the chart, we have S1 that used to be a resistance area in the past. Presently, the price was rejected at R1 and now it is fluctuating below this area. We believe the price is able to continue its falling trend to touch S1. Then there will be two options. By having some rising signs and more fixation, an increase will happen to higher amounts such as R1 or higher. But if the price is not supported when it reaches S1 and it gives us some falling signs, definitely it would face a decline to lower amounts. In case you are in favor of experiencing profitable trades and wise actions in your analyses, we have several points and tips in our updates; so follow us all the time.
Warning: This is just a suggestion and we do not guarantee profits. We advise you to analyze the chart before opening any positions.
Wish you luck
Mars Signals team wishes you high profits.
This is a 4-hour-time frame analysis for FTMUSDT
In this chart, R3, R2, and R1 are our resistance areas in which the unsuccessful triumphs of price is clearly seen. And at the bottom of the chart, we have S1 that used to be a resistance area in the past. Presently, the price was rejected at R1 and now it is fluctuating below this area. We believe the price is able to continue its falling trend to touch S1. Then there will be two options. By having some rising signs and more fixation, an increase will happen to higher amounts such as R1 or higher. But if the price is not supported when it reaches S1 and it gives us some falling signs, definitely it would face a decline to lower amounts. In case you are in favor of experiencing profitable trades and wise actions in your analyses, we have several points and tips in our updates; so follow us all the time.
Warning: This is just a suggestion and we do not guarantee profits. We advise you to analyze the chart before opening any positions.
Wish you luck
Disclaimer
The information and publications are not meant to be, and do not constitute, financial, investment, trading, or other types of advice or recommendations supplied or endorsed by TradingView. Read more in the Terms of Use.
Disclaimer
The information and publications are not meant to be, and do not constitute, financial, investment, trading, or other types of advice or recommendations supplied or endorsed by TradingView. Read more in the Terms of Use.