FTM ""Double Bottom"" Weekly Chart
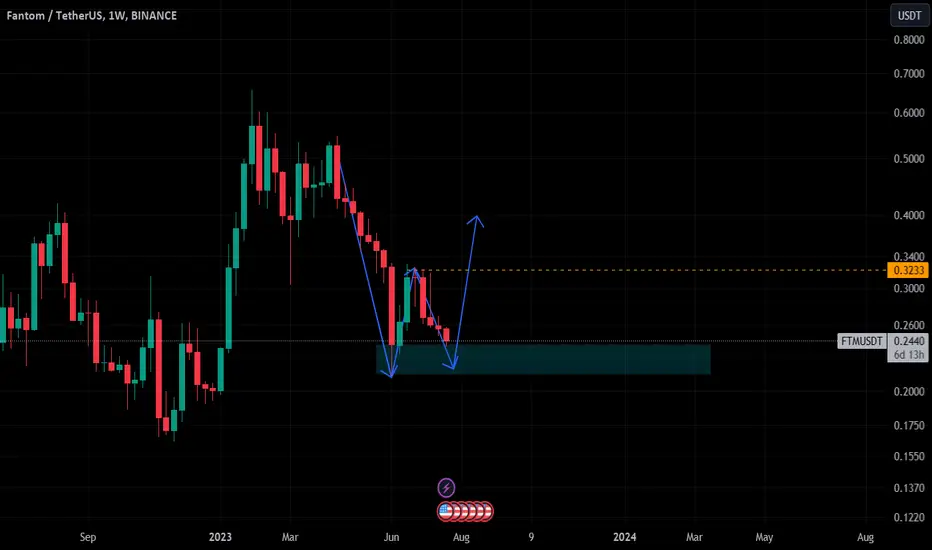
FTM is looking great as it is also forming a double bottom on weekly timeframe. The higher the timeframe the better it is.
It also started to form bullish divergence on 4h timeframe as shared in the previous idea.
We need to wait for the BREAK and RETEST of the NECKLINE marked with orange dotted line.
LETS PUMP IT !!
DYOR, NFA
It also started to form bullish divergence on 4h timeframe as shared in the previous idea.
We need to wait for the BREAK and RETEST of the NECKLINE marked with orange dotted line.
LETS PUMP IT !!
DYOR, NFA
Related publications
Disclaimer
The information and publications are not meant to be, and do not constitute, financial, investment, trading, or other types of advice or recommendations supplied or endorsed by TradingView. Read more in the Terms of Use.
Related publications
Disclaimer
The information and publications are not meant to be, and do not constitute, financial, investment, trading, or other types of advice or recommendations supplied or endorsed by TradingView. Read more in the Terms of Use.