FTM / USDT 1D Interval - Targets and Stoploss
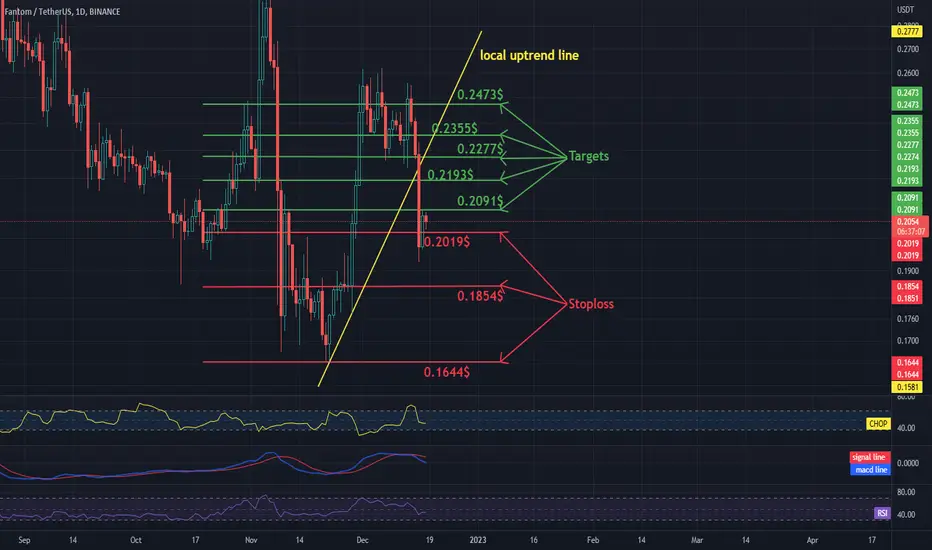
Hello everyone, let's look at the 1D FTM to USDT chart as you can see that the price is moving below the local uptrend line.
Let's start by setting goals for the near future that we can take into account:
T1 = $0.2091
T2 = $0.2193
T3 = $0.2277
T4 = $0.2355
and
T5 = $0.2473
Now let's move on to the stop loss in case the market goes down further:
SL1 = $0.2019
SL2 = $0.1854
and
SL3 = $0.1644
Looking at the CHOP indicator, we see that most of the energy has been used on the 1D interval, the MACD indicator indicates that we are moving in a local downtrend.
Disclaimer
The information and publications are not meant to be, and do not constitute, financial, investment, trading, or other types of advice or recommendations supplied or endorsed by TradingView. Read more in the Terms of Use.
Disclaimer
The information and publications are not meant to be, and do not constitute, financial, investment, trading, or other types of advice or recommendations supplied or endorsed by TradingView. Read more in the Terms of Use.