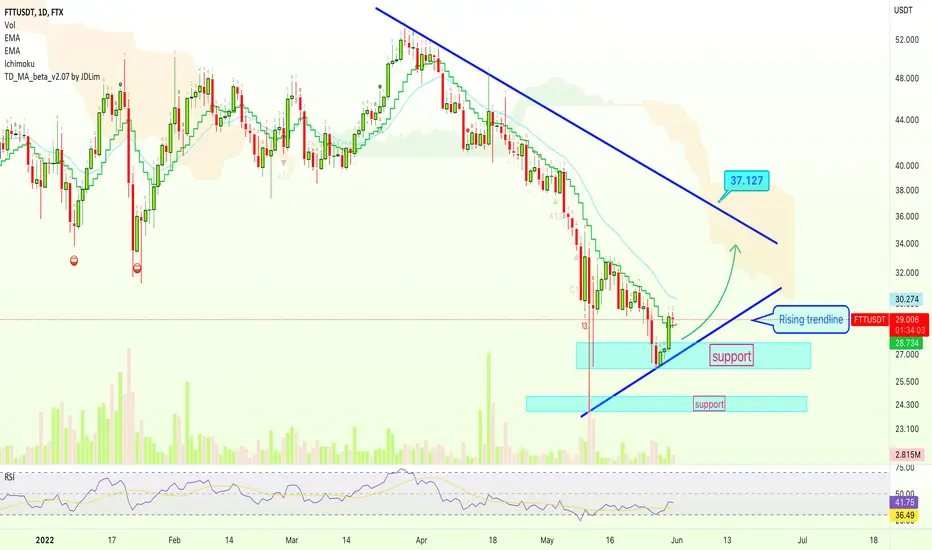
We can see that FTTUSDT (FTX Token) managed to break above EMA10 on negligible volume... Which isn't really good but, once we have a bounce start to develop, we can see the counter-trendline being challenge, this is mapped on the chart.
We stay bullish above the "rising trendline".
We turn/switch/adapt to bearish below "support".
We aim at $35-$37 as bullish target on the next jump.
Namaste.
We stay bullish above the "rising trendline".
We turn/switch/adapt to bearish below "support".
We aim at $35-$37 as bullish target on the next jump.
Namaste.
🚨 TOP FREE Trades
ETH +1450% · AAVE +1134%
XRP +749% · DOGS +868%
BTC +563% · SOL +658%
t.me/anandatrades/1350
🚨 FREE Analyses & New Results
t.me/masteranandatrades/6499
🚨 PREMIUM LIFETIME (Since 2017)
lamatrades.com
ETH +1450% · AAVE +1134%
XRP +749% · DOGS +868%
BTC +563% · SOL +658%
t.me/anandatrades/1350
🚨 FREE Analyses & New Results
t.me/masteranandatrades/6499
🚨 PREMIUM LIFETIME (Since 2017)
lamatrades.com
Related publications
Disclaimer
The information and publications are not meant to be, and do not constitute, financial, investment, trading, or other types of advice or recommendations supplied or endorsed by TradingView. Read more in the Terms of Use.