#FTT/USDT Technical Analysis 🚀
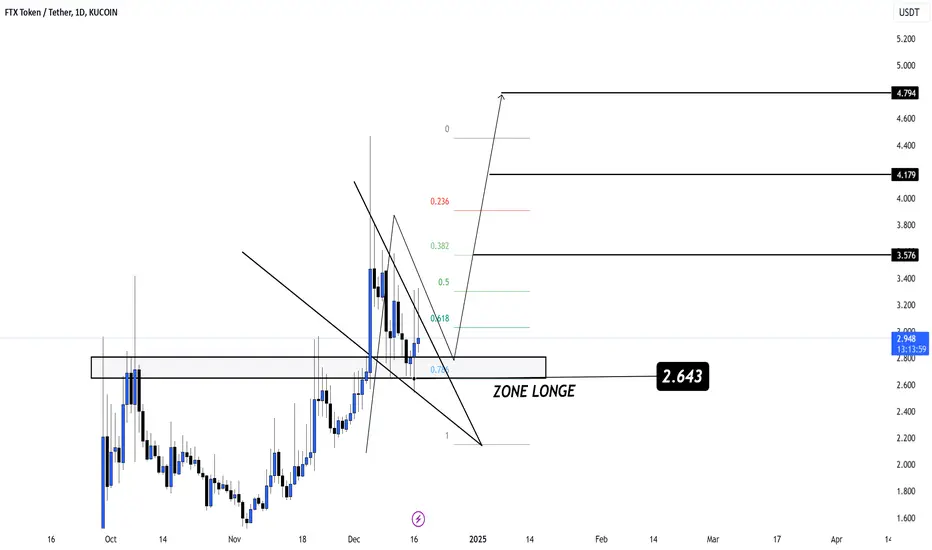
FFTT/USDT is consolidating above the Zone Long at $2.643, a key support area that aligns with the 0.786 Fibonacci level, signaling a potential rebound. The first target (T1) is $3.576, followed by $4.179, and the extended target at $4.794. A break above the downtrend resistance and strong buying volume would confirm the bullish momentum. Stop-loss can be placed below $2.643 to manage risk effectively
FFTT/USDT is consolidating above the Zone Long at $2.643, a key support area that aligns with the 0.786 Fibonacci level, signaling a potential rebound. The first target (T1) is $3.576, followed by $4.179, and the extended target at $4.794. A break above the downtrend resistance and strong buying volume would confirm the bullish momentum. Stop-loss can be placed below $2.643 to manage risk effectively
Subscribe to my Telegram Channel 👉 :
t.me/addlist/y5mi70s3c0Y3MDQ0
Subscribe to my X 👉 : x.com/VIPROSETR
t.me/addlist/y5mi70s3c0Y3MDQ0
Subscribe to my X 👉 : x.com/VIPROSETR
Disclaimer
The information and publications are not meant to be, and do not constitute, financial, investment, trading, or other types of advice or recommendations supplied or endorsed by TradingView. Read more in the Terms of Use.