Technical Analysis for FTT/USDT Based on Weekly Chart
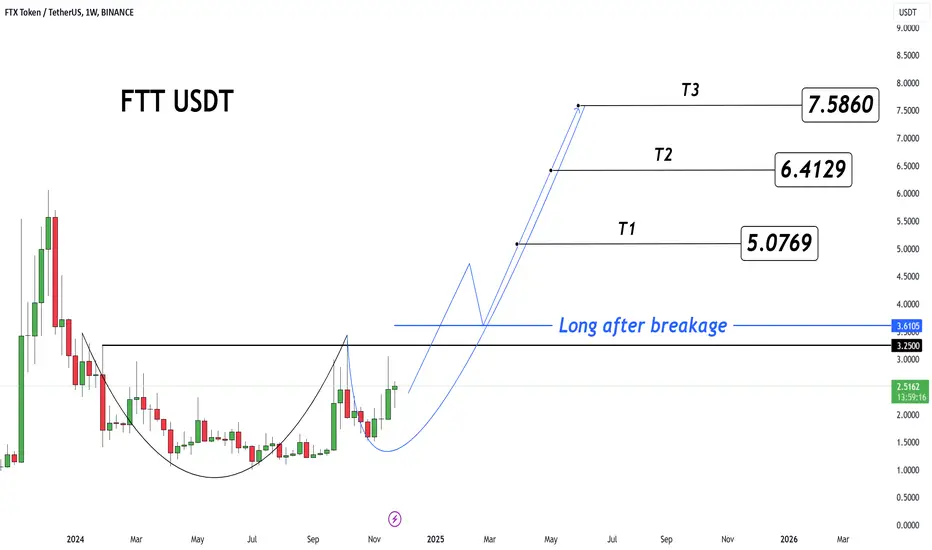
 FTT #FTT The chart illustrates the formation of a Cup and Handle pattern, which is a strong bullish continuation signal.
The breakout above the $3.610 resistance level will likely confirm the pattern and open the door for further upside.
The major support level lies at $3.250, which serves as a base for bullish continuation.
Targets:
T1: $5.0769
T2: $6.4129
T3: $7.5860
The breakout above the $3.610 resistance level will likely confirm the pattern and open the door for further upside.
The major support level lies at $3.250, which serves as a base for bullish continuation.
Targets:
T1: $5.0769
T2: $6.4129
T3: $7.5860
Subscribe to my Telegram Channel 👉 :
t.me/addlist/y5mi70s3c0Y3MDQ0
Subscribe to my X 👉 : x.com/VIPROSETR
t.me/addlist/y5mi70s3c0Y3MDQ0
Subscribe to my X 👉 : x.com/VIPROSETR
Disclaimer
The information and publications are not meant to be, and do not constitute, financial, investment, trading, or other types of advice or recommendations supplied or endorsed by TradingView. Read more in the Terms of Use.