Updated
FUNBTC H&S vs Bullish mood and indicators
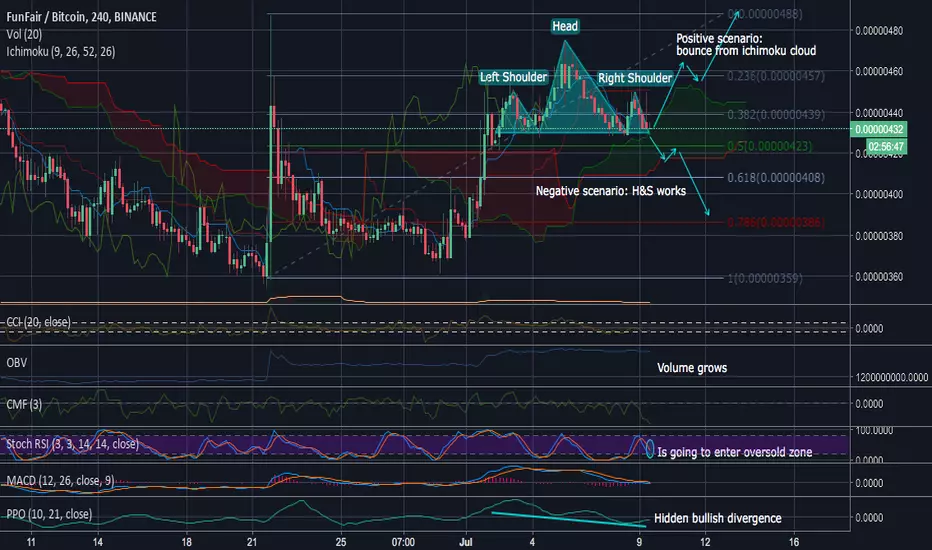
In a process of market analysis we mentioned formed H&S pattern at the uptrend which is a strong bearish sign. However more detailed analysis revealed there is hidden bullish divergence and the most indicators are bullish: Awesome Oscillator, Momentum (10), MACD Level (12, 27), Volume Weighted Moving Average (20), SMA and EMA (10, 20, 30). Moreover the price is at the edge of the strong support of Ichimoku cloud zone which is enhance by Fibonacci retracement support level.
Overall it can be said that the possibility of going down is still presents, but it is much more likely that there should be bounce and sudden pump like 2 times before soon.
Overall it can be said that the possibility of going down is still presents, but it is much more likely that there should be bounce and sudden pump like 2 times before soon.
Trade active
Special situation and bullish indicators appeared to be much weaker than H&S pattern and the price as it usually happens when Head and shoulders are formed went down. Nevertheless price didn't touched stop loss and there should be a rebound soonAccess private PineScript strategies and turn alerts into orders with easy-to-set up bots
Trade smarter with:
skyrexio.com
Trade smarter with:
skyrexio.com
Disclaimer
The information and publications are not meant to be, and do not constitute, financial, investment, trading, or other types of advice or recommendations supplied or endorsed by TradingView. Read more in the Terms of Use.
Access private PineScript strategies and turn alerts into orders with easy-to-set up bots
Trade smarter with:
skyrexio.com
Trade smarter with:
skyrexio.com
Disclaimer
The information and publications are not meant to be, and do not constitute, financial, investment, trading, or other types of advice or recommendations supplied or endorsed by TradingView. Read more in the Terms of Use.