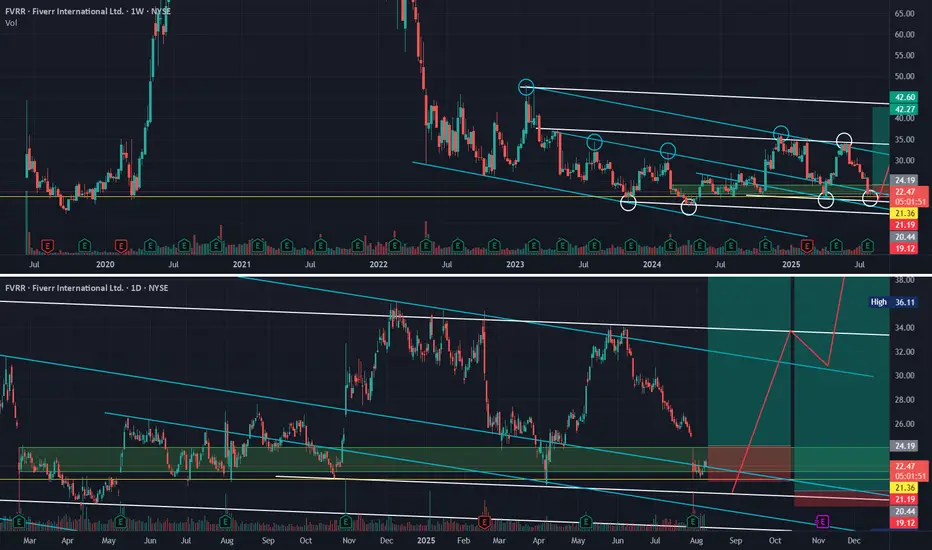
FVRR. We all know the company. Many of us have probably waited patiently for a covid-like resemblance of the stock price. And yet here we are, sitting at $22, wondering if we'll ever reach $40 again.
I'm here to tell you, aside from the company being fundamentally strong and proving that with earnings and revenue growth YOY, the algorithms have got your back technically as well!
The overall reason I am technically bullish on this company and have been since April 2024 is the white algorithm as outlined by the white circles in the weekly chart above. Notice any time we are selling down and respecting teal/blue on the buy-side (blue circles), we hold and respect white taper (white circles) on the sell-side and allow for price to make it's way up back toward teal.
Once we prove the white algorithm on the buy-side as well, we will break out of this LTF consolidation and head toward HTF algorithms.
I want to prime you for three possible scenarios:
#1.
We are holding a very strong multi-year demand zone (green box). If we continue to hold this and close back above, as with every other time, it is a strong buy signal.
#2.
We are holding above a multi-year support zone at $21.70 (yellow line). This has held us (save for one or two liquidity grabs) since the company's IPO. Another attempt at this level will be a no-brainer scoop-up as far as R:R is concerned.
#3.
My prediction (and hope) is that we are trying, once again, to prove this white tapered algorithm on the sell-side. If we do that, we give price the ability/permission to break out of teal once and for all and head toward the fair-value pricing of this company (according to all the analysts - not me) in the $40+ range.
This is another one that may require a bit of patience to get the best case scenario - allowing for a push lower toward our HTF white algorithm.
In any case, I am still bullish on this chart - even with all the selling pressure and sideways movement.
Happy Trading :)
Related publications
Disclaimer
The information and publications are not meant to be, and do not constitute, financial, investment, trading, or other types of advice or recommendations supplied or endorsed by TradingView. Read more in the Terms of Use.
Related publications
Disclaimer
The information and publications are not meant to be, and do not constitute, financial, investment, trading, or other types of advice or recommendations supplied or endorsed by TradingView. Read more in the Terms of Use.
