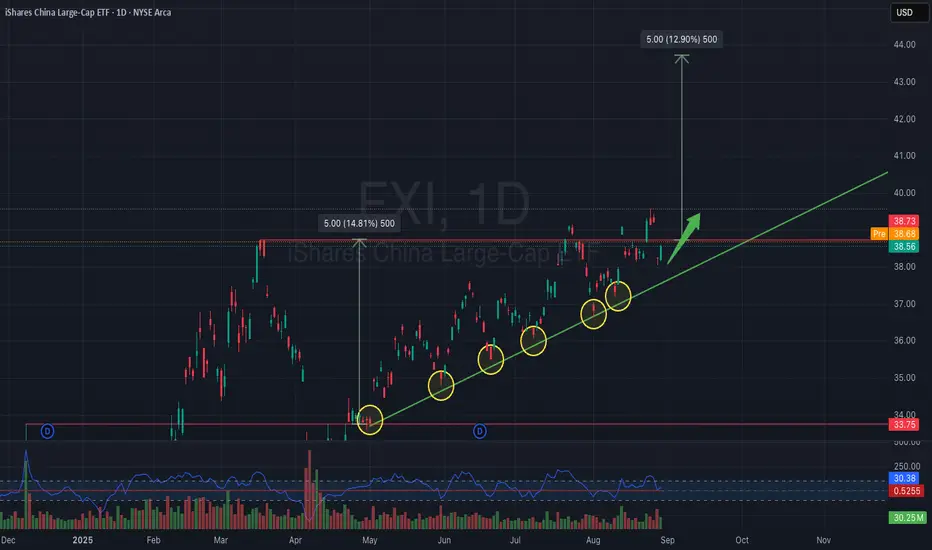
The chart of iShares China Large-Cap ETF (FXI) shows a strong ascending trendline, tested multiple times (yellow circles), confirming bullish support.
Currently, FXI is consolidating just below resistance at $39, and a breakout above this level could trigger a strong upward move. The projected target is around $43–44, which aligns with a 12–13% upside potential.
Entry Zone: Above $39 breakout
Target Price: $43–44
Stop Loss: Below $37 (trendline support)
Momentum is supported by higher lows, consistent trendline touches, and a constructive RSI setup. If the breakout holds, bulls may push FXI toward prior highs.
Disclaimer
The information and publications are not meant to be, and do not constitute, financial, investment, trading, or other types of advice or recommendations supplied or endorsed by TradingView. Read more in the Terms of Use.
Disclaimer
The information and publications are not meant to be, and do not constitute, financial, investment, trading, or other types of advice or recommendations supplied or endorsed by TradingView. Read more in the Terms of Use.