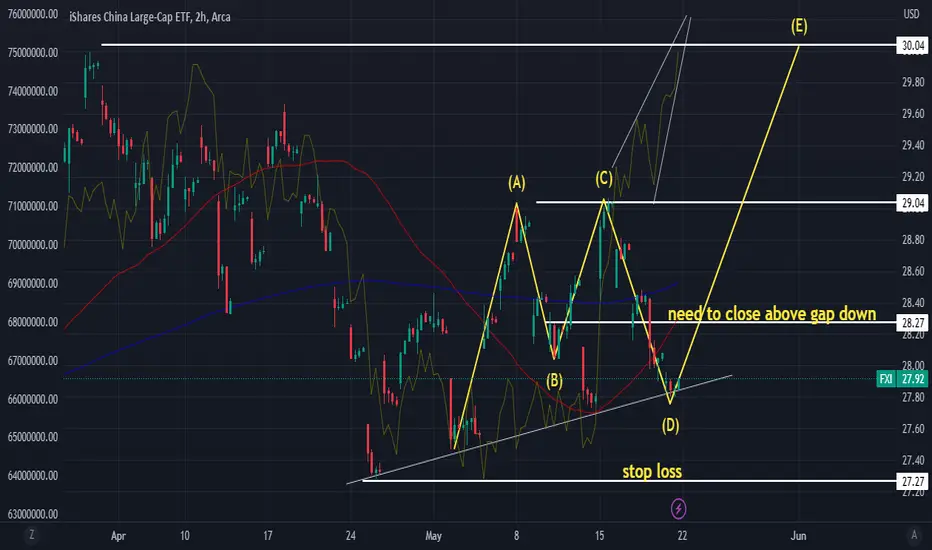
Key things I see
1) The AD in an ascending triangle, I see this on multiple time frames
2) Bullish ABCDE set up
3) The Results of the ABCDE set up appears to be a Bullish Cypher
4) also have a potential desc. triangle breakout
5) Uptrend going back to April 24th 2023
6) Stop Loss at the beginning of the uptrend
7) FXI needs to close above the Gap down
8) BABA stock chart already looks bullish, more bullish if fxi resumes the upward trend
No position currently, looking to add above the Gap Down. If it does I'll enter w/ a stop loss at the beginning of the upward trend
Note
bullish cypher view Related publications
Disclaimer
The information and publications are not meant to be, and do not constitute, financial, investment, trading, or other types of advice or recommendations supplied or endorsed by TradingView. Read more in the Terms of Use.
Related publications
Disclaimer
The information and publications are not meant to be, and do not constitute, financial, investment, trading, or other types of advice or recommendations supplied or endorsed by TradingView. Read more in the Terms of Use.