🧠 Overview:
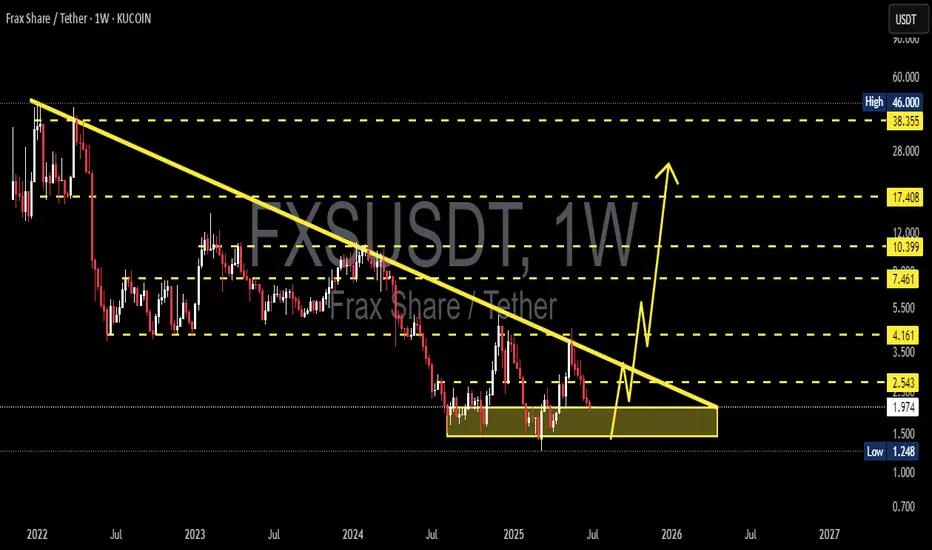
Frax Share (FXS) has been consolidating in a long-term accumulation phase, forming a strong base in the $1.24 – $2.54 zone for over a year. This prolonged sideways movement suggests institutional accumulation and a potential macro reversal, especially as the price is tightening near a major descending trendline that has acted as dynamic resistance since early 2022.
The chart is setting up for what could be a massive bullish breakout, with multiple confluences aligning technically and psychologically.
🧱 Technical Structure & Pattern Analysis:
Pattern: The chart shows signs of a falling wedge combined with a horizontal accumulation base, which is typically a bullish reversal structure.
Descending Trendline: The yellow diagonal trendline has been respected for over 2 years. Price is now coiling below it, hinting at a potential volatility expansion.
Accumulation Range: Price has consistently respected the $1.24 – $2.54 support range (highlighted in yellow), forming a multi-touch base, which strengthens the validity of this demand zone.
Volume: While volume isn't shown, such long consolidations often coincide with volume contraction, followed by explosive moves when volume returns.
🟢 Bullish Scenario (High Probability):
1. Breakout Above $2.54 confirms exit from the accumulation range.
2. Initial targets:
$4.16 – Previous resistance + psychological round level
$7.46 – Major horizontal S/R flip
$10.39 – Weekly supply zone
3. Mid to Long-Term Targets:
$17.40 – Pre-breakdown support from 2022
$38.35 and even $46.00 – Full bullish cycle potential (ATH zone)
📌 Catalyst: A weekly candle close above $2.54 with increased volume could trigger a cascade of bullish momentum and possibly attract large buyers or breakout traders.
🔴 Bearish Scenario (Low Probability but Must Consider):
1. Breakdown below $1.24 would invalidate the base and potentially lead to:
Retesting uncharted lows near $1.00 or lower
Loss of investor confidence in the short to mid term
2. Such a move could suggest distribution rather than accumulation, but this currently lacks confirmation from price action.
🧠 Strategic Insight:
This chart is a textbook example of “High Risk, High Reward”. Smart traders and swing investors often hunt for assets in deep accumulation zones with favorable reward-to-risk setups — and FXS fits this criterion perfectly.
Entering on retests above $2.54 or accumulating in the current zone with tight stop-losses below $1.24 offers compelling upside with controlled downside.
📊 Key Technical Levels to Watch:
Level Description
$1.24 - $2.54 Demand Zone / Accumulation Base
$2.54 Breakout Confirmation Level
$4.16 First Key Resistance
$7.46 Major Resistance
$10.39 Mid-Term Bull Target
$17.40 Pre-breakdown Zone
$38.35 - $46 Long-Term Bull Cycle Target
🧭 Conclusion:
FXS is quietly preparing for a major breakout move, and the current chart setup indicates that patient accumulation might soon pay off. Whether you're a technical trader, long-term investor, or a crypto strategist, FXS deserves a spot on your watchlist right now.
This could be one of those “before the hype” moments — don’t miss it.
#FXS #FXSUSDT #CryptoBreakout #AltcoinSetup #TechnicalAnalysis #Accumulation #FallingWedge #BullishCrypto #CryptoChart #FXSTechnical #SwingTrade
✅ Get Free Signals! Join Our Telegram Channel Here: t.me/TheCryptoNuclear
✅ Twitter: twitter.com/crypto_nuclear
✅ Join Bybit : partner.bybit.com/b/nuclearvip
✅ Benefits : Lifetime Trading Fee Discount -50%
✅ Twitter: twitter.com/crypto_nuclear
✅ Join Bybit : partner.bybit.com/b/nuclearvip
✅ Benefits : Lifetime Trading Fee Discount -50%
Disclaimer
The information and publications are not meant to be, and do not constitute, financial, investment, trading, or other types of advice or recommendations supplied or endorsed by TradingView. Read more in the Terms of Use.