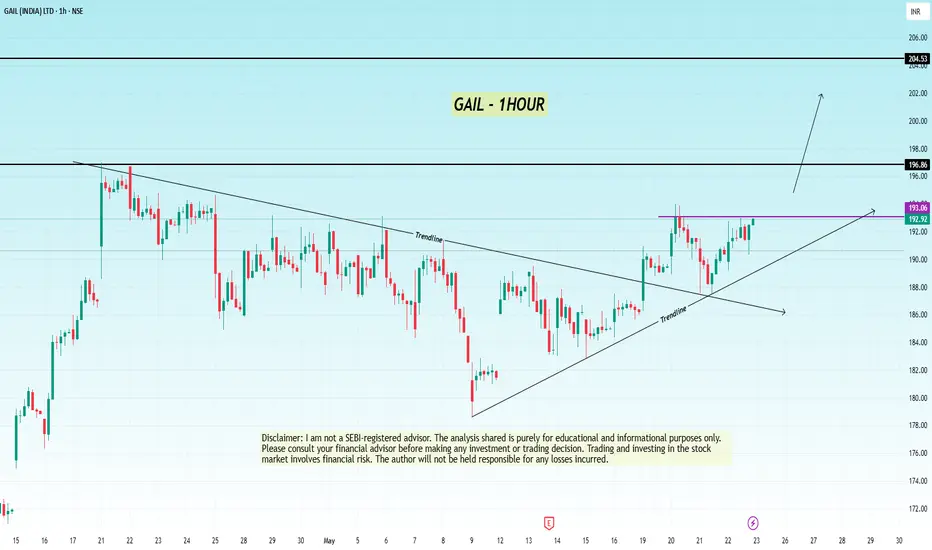
The 1-hour chart of GAIL (India) Ltd shows a clean descending trendline breakout followed by higher lows, indicating strength building up. The price is consolidating just below a horizontal resistance around ₹193, forming a potential ascending triangle pattern.
Trendline Breakout:
Price has broken a long-standing descending trendline.
Retest and higher lows have followed the breakout, showing bullish intent.
Ascending Triangle Pattern:
Horizontal resistance near ₹193 is tested multiple times.
Rising trendline support suggests buyers are becoming aggressive.
Volume Confirmation Needed:
A breakout above ₹193.10 with volume would validate the bullish setup.
Trade Setup:
Buy Entry: Above ₹193.10 (confirmed breakout
Stop Loss: Below ₹190.00 (below rising trendline) CLOSING BASIS
Target 1: ₹196.85 (resistance zone)
Target 2: ₹204.50 (swing high)
The combination of trendline breakout and ascending triangle formation indicates a strong bullish continuation setup. Entry above ₹193.10 is ideal after confirmation, with targets up to ₹204 and risk well-managed below ₹190.
Disclaimer: I am not a SEBI-registered advisor. The analysis shared is purely for educational and informational purposes only. Please consult your financial advisor before making any investment or trading decision. Trading and investing in the stock market involves financial risk. The author will not be held responsible for any losses incurred.
thetradeforecast
Trade active
trade got active after small consolidation keep riding
Disclaimer
The information and publications are not meant to be, and do not constitute, financial, investment, trading, or other types of advice or recommendations supplied or endorsed by TradingView. Read more in the Terms of Use.
Disclaimer
The information and publications are not meant to be, and do not constitute, financial, investment, trading, or other types of advice or recommendations supplied or endorsed by TradingView. Read more in the Terms of Use.