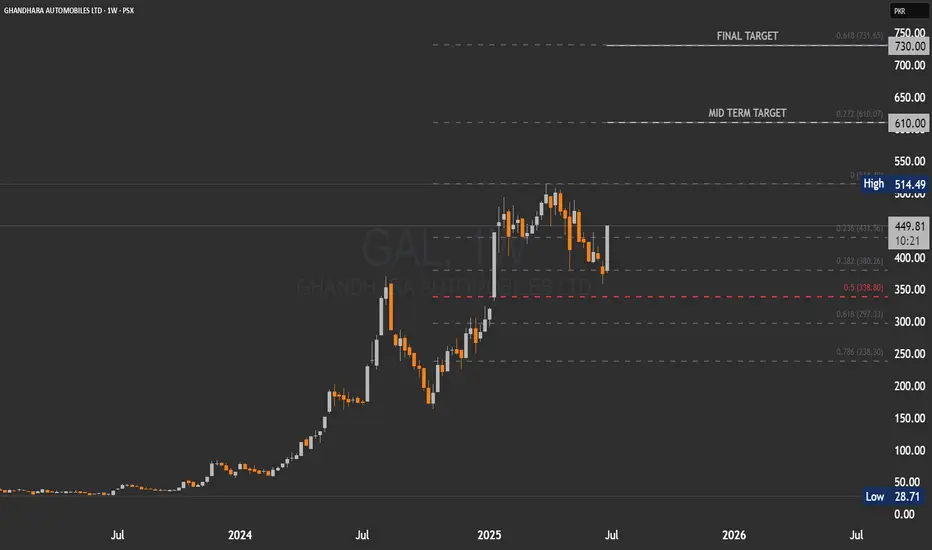
The weekly chart of GAL shows a strong bullish reversal after a prolonged correction phase. The stock has surged by nearly 19% this week, indicating renewed buying interest and potential trend continuation. Key resistance zones lie at 610 (mid-term target) and 730 (final target), while support rests near the breakout area of 446. Sustaining above this level may lead to further upside, though minor pullbacks could occur as part of healthy profit-taking. Overall, the chart structure favors a bullish outlook with a medium- to long-term perspective.
Disclaimer
The information and publications are not meant to be, and do not constitute, financial, investment, trading, or other types of advice or recommendations supplied or endorsed by TradingView. Read more in the Terms of Use.
Disclaimer
The information and publications are not meant to be, and do not constitute, financial, investment, trading, or other types of advice or recommendations supplied or endorsed by TradingView. Read more in the Terms of Use.