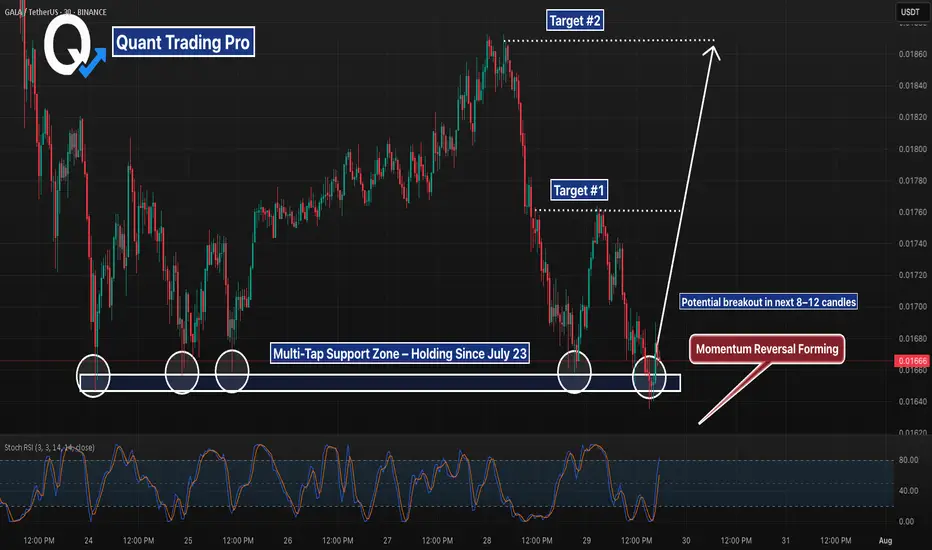
GALA is forming a clean, high-probability bottoming structure on the 30-minute timeframe. Price has now tested the $0.0166–0.0167 support zone four separate times without a clean break — a sign that sellers may be exhausting while buyers continue to absorb pressure.
This “quadruple bottom” formation is significant on intraday timeframes. Not only has the level held since July 23, but each rejection has been followed by increasingly aggressive recoveries, creating a compression-like structure that often precedes breakout moves.
On top of that, Stochastic RSI has just crossed bullish from oversold, hinting at renewed upside momentum. Price is also approaching the breakout zone from a descending wedge-like pattern, with a potential move toward $0.0178 (Target #1) and $0.0188 (Target #2) if bulls reclaim control.
📊 What strengthens the setup:
– Multi-tap support with consistent bounce reactions
– Momentum flip from oversold (Stoch RSI)
– Clean invalidation below support = strong risk/reward
– Volume build-up likely to confirm breakout continuation
While no setup is guaranteed, this one is technically clean, visually obvious, and risk-defined — making it a chart to watch closely over the next few sessions.
Try our strategy optimizer at quanttradingpro.com
Developing free strategies weekly stay tuned...
Join our discord discord.gg/2systG9frc
We provide education & tools.
Developing free strategies weekly stay tuned...
Join our discord discord.gg/2systG9frc
We provide education & tools.
Disclaimer
The information and publications are not meant to be, and do not constitute, financial, investment, trading, or other types of advice or recommendations supplied or endorsed by TradingView. Read more in the Terms of Use.