Hi traders
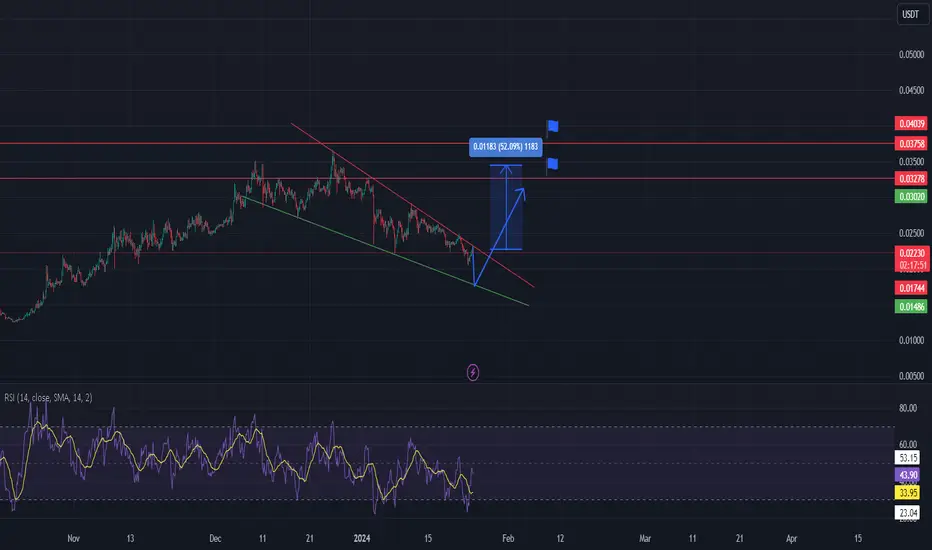
Let"s take a look at GALA chart on the 4 hours time frame. The price has been creating lower highs and lower lows. The price has been in a bearish trend and has been creating the falling wedge pattern. We expect the price to break the downslopimg resistance line to upside. If this happens we would take a long position. Let"s wait until the breakout occurs.
Targets are shown on the chart
Note
GALA is getting bullish momentumTrade closed: target reached
technical targets reached.💥 Free signals and ideas ➡ t.me/vfinvestment
Disclaimer
The information and publications are not meant to be, and do not constitute, financial, investment, trading, or other types of advice or recommendations supplied or endorsed by TradingView. Read more in the Terms of Use.
💥 Free signals and ideas ➡ t.me/vfinvestment
Disclaimer
The information and publications are not meant to be, and do not constitute, financial, investment, trading, or other types of advice or recommendations supplied or endorsed by TradingView. Read more in the Terms of Use.