GALA/USDT – ABCDE Correction & Breakout Potential
The chart illustrates a well-defined ABCDE corrective structure:
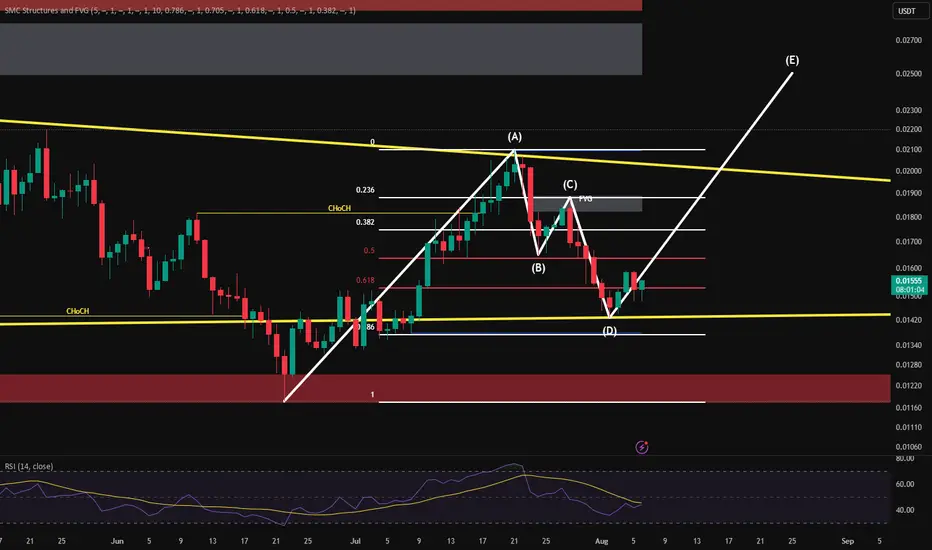
🔹 Point (A): Rejection at key resistance near 0.02100
🔹 Point (B): Pullback to the 0.5–0.618 Fibonacci zone
🔹 Point (C): Short-term rebound & FVG mitigation
🔹 Point (D): Strong support reaction on confluence of:
✅ 0.786 Fib retracement
✅ Long-term trendline (yellow)
✅ Demand zone (bottom red box)
📈 Next Move?
If (D) holds, the pattern suggests a move toward (E), targeting the breakout above descending resistance near 0.02292, aligning with a macro FVG zone and prior supply.
The chart illustrates a well-defined ABCDE corrective structure:
🔹 Point (A): Rejection at key resistance near 0.02100
🔹 Point (B): Pullback to the 0.5–0.618 Fibonacci zone
🔹 Point (C): Short-term rebound & FVG mitigation
🔹 Point (D): Strong support reaction on confluence of:
✅ 0.786 Fib retracement
✅ Long-term trendline (yellow)
✅ Demand zone (bottom red box)
📈 Next Move?
If (D) holds, the pattern suggests a move toward (E), targeting the breakout above descending resistance near 0.02292, aligning with a macro FVG zone and prior supply.
Disclaimer
The information and publications are not meant to be, and do not constitute, financial, investment, trading, or other types of advice or recommendations supplied or endorsed by TradingView. Read more in the Terms of Use.
Disclaimer
The information and publications are not meant to be, and do not constitute, financial, investment, trading, or other types of advice or recommendations supplied or endorsed by TradingView. Read more in the Terms of Use.