Hello 🐋
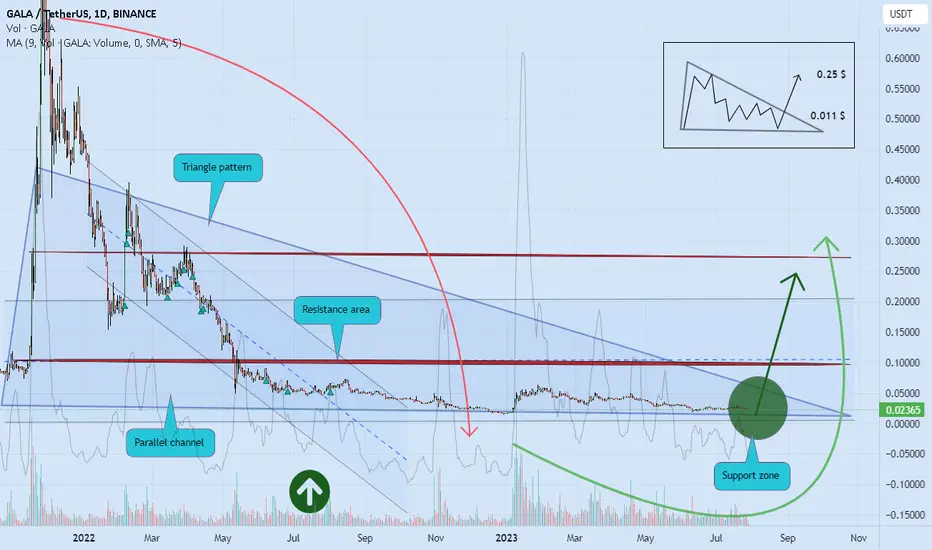
Based on the chart, the price is in the parallel channel and close to the channel support area, and triangle pattern ✔️
if
the price doesn't break the support zone to the downside, we will see more gain 💣🚀
otherwise
we can see more correction to lower support level ❌🧨
if
breakout of the upper resistance zone be completed, we can see more pump to the upside ✔️🚀
👌 Notice: pay attention to the price on shortcut chart (located below the main chart with black colour) 📖💡
Please, feel free to share your point of view, write it in the comments below, thanks 🐋
Educational plans & Free signals, all in telegram:👉t.me/madwhalechannel
Hey buddy, If you’re up for it, would love if you signed up on this exchange with my link. I get a tiny cut no ads, no pressure, just a little love: 👇bit.ly/4jp4yMI
Hey buddy, If you’re up for it, would love if you signed up on this exchange with my link. I get a tiny cut no ads, no pressure, just a little love: 👇bit.ly/4jp4yMI
Disclaimer
The information and publications are not meant to be, and do not constitute, financial, investment, trading, or other types of advice or recommendations supplied or endorsed by TradingView. Read more in the Terms of Use.