1. **Price Trend**:
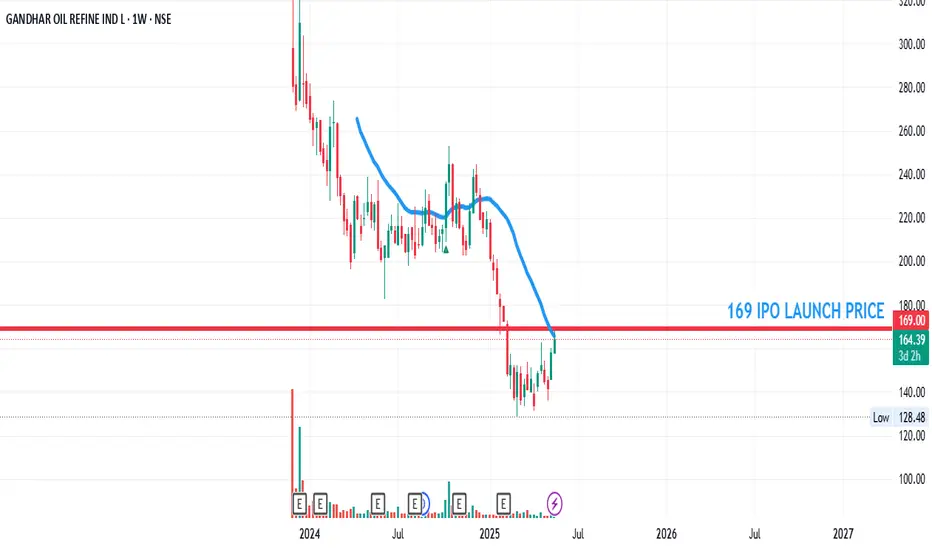
* The price has been in a **downtrend** for a significant period.
* Recently, it formed a **bottom** and is attempting a **reversal** or a **pullback**.
2. **Moving Average 20MA
* The price was below the moving average during the downtrend.
* **Now, price has crossed above the moving average**, which can be an early **bullish signal**.
3. **Volume**:
* There was **high selling volume** during the major drop.
* Recent candles show **increasing green volume**, suggesting **buyer interest**.
4. **Potential Double Bottom or Reversal Setup**:
* The price shows a rounding pattern at the bottom.
* If the price sustains above the moving average, it could indicate a **trend reversal**.
---
* **Short-Term Bullish Bias**: If the price continues to stay above the moving average and volume confirms, you could see a **short-term up move**.
* **Watch for Resistance**: Price may face resistance near the previous consolidation zone near 200
* **Confirmation Needed**: Look for confirmation candles (like a strong bullish candle above moving average or a retest of the average with support).
---
SL 150 FULL AND FINAL
Disclaimer
The information and publications are not meant to be, and do not constitute, financial, investment, trading, or other types of advice or recommendations supplied or endorsed by TradingView. Read more in the Terms of Use.
Disclaimer
The information and publications are not meant to be, and do not constitute, financial, investment, trading, or other types of advice or recommendations supplied or endorsed by TradingView. Read more in the Terms of Use.