🔻
Trade Type: Short
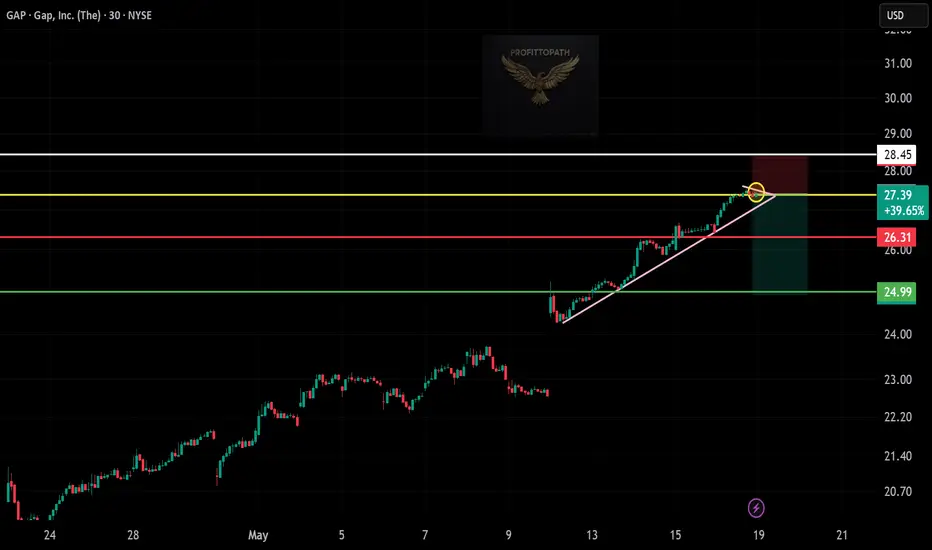
Ticker: GAP (GPS)
Timeframe: 30-Min Chart
Pattern: Rising wedge breakdown (bearish signal)
📉 Entry Point:
Around $27.39
Price hit resistance and broke the rising wedge trendline (yellow circle shows breakdown)
🔒 Stop-Loss:
Above $28.45
Above recent swing high and wedge invalidation
🎯 Take Profit Targets:
TP1: $26.31 (first support zone)
TP2: $24.99 (major horizontal support)
⚖️ Risk-Reward Ratio:
Risk: ~$1.06
Reward: ~$2.40
R:R ≈ 2.3:1 (solid potential for short trade)
🔍 Technical Highlights:
Bearish rejection at resistance
Rising wedge broke with increasing selling pressure
Price overextended from previous base
Trade Type: Short
Ticker: GAP (GPS)
Timeframe: 30-Min Chart
Pattern: Rising wedge breakdown (bearish signal)
📉 Entry Point:
Around $27.39
Price hit resistance and broke the rising wedge trendline (yellow circle shows breakdown)
🔒 Stop-Loss:
Above $28.45
Above recent swing high and wedge invalidation
🎯 Take Profit Targets:
TP1: $26.31 (first support zone)
TP2: $24.99 (major horizontal support)
⚖️ Risk-Reward Ratio:
Risk: ~$1.06
Reward: ~$2.40
R:R ≈ 2.3:1 (solid potential for short trade)
🔍 Technical Highlights:
Bearish rejection at resistance
Rising wedge broke with increasing selling pressure
Price overextended from previous base
Disclaimer
The information and publications are not meant to be, and do not constitute, financial, investment, trading, or other types of advice or recommendations supplied or endorsed by TradingView. Read more in the Terms of Use.
Disclaimer
The information and publications are not meant to be, and do not constitute, financial, investment, trading, or other types of advice or recommendations supplied or endorsed by TradingView. Read more in the Terms of Use.