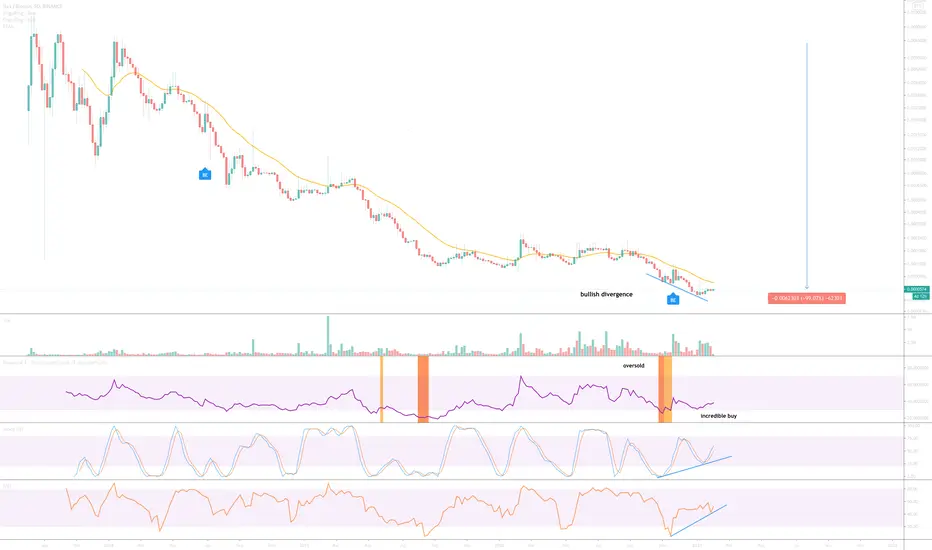
Following a massive 99% correction in price action and oversold condition (orange column), there now exists an “incredible buy” opportunity.
On the above 5-day chart price action prints a regular bullish divergence with the oscillators (all three of them, RSI, St RSI, & MFI). A divergence with all three oscillators on the 5-day chart is powerful.
Currently the alt-coins (some not all!) are showing bullish divergences with price action returning to their previous highs. On the 5-day dollar chart below you can see a trend reversal is in play with a recently printed higher low.
Neo Gas market capital is very small and it is clear there’s been a lot of accumulation during the consolidation period. As a result price action will likely move up very rapidly when volume comes in.
1st target - 27k sats / $31 dollars
Trade active
Trade active
A very impressive test of support on the daily combined with the above divergence. Given the market capital I suspect price action will move quickly, don't be in the rush for the exit when that happens.BTC
bc1q2eckdzh0q8vsd7swcc8et6ze7s99khhxyl7zwy
Weblink: patreon.com/withoutworries
Allow 3-6 months on ideas. Not investment advice. DYOR
bc1q2eckdzh0q8vsd7swcc8et6ze7s99khhxyl7zwy
Weblink: patreon.com/withoutworries
Allow 3-6 months on ideas. Not investment advice. DYOR
Disclaimer
The information and publications are not meant to be, and do not constitute, financial, investment, trading, or other types of advice or recommendations supplied or endorsed by TradingView. Read more in the Terms of Use.
BTC
bc1q2eckdzh0q8vsd7swcc8et6ze7s99khhxyl7zwy
Weblink: patreon.com/withoutworries
Allow 3-6 months on ideas. Not investment advice. DYOR
bc1q2eckdzh0q8vsd7swcc8et6ze7s99khhxyl7zwy
Weblink: patreon.com/withoutworries
Allow 3-6 months on ideas. Not investment advice. DYOR
Disclaimer
The information and publications are not meant to be, and do not constitute, financial, investment, trading, or other types of advice or recommendations supplied or endorsed by TradingView. Read more in the Terms of Use.