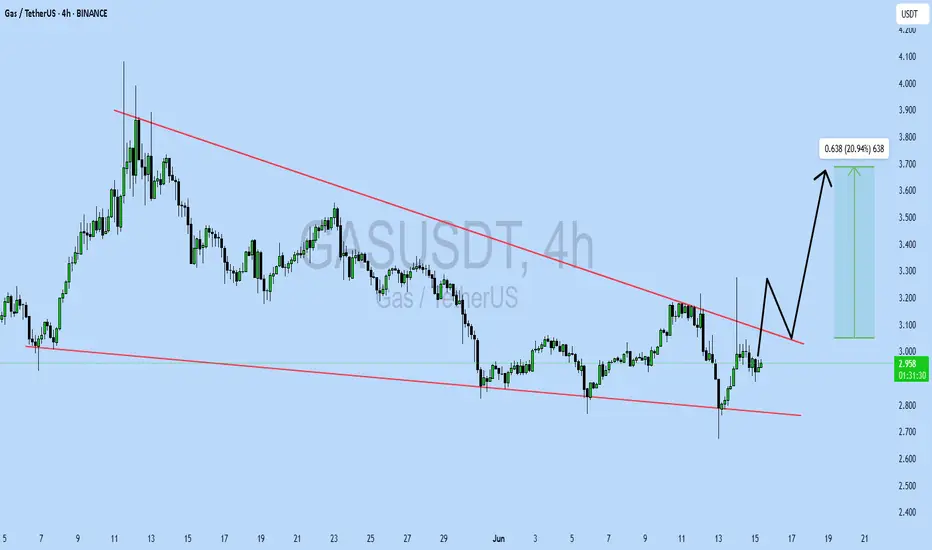
Pattern: Falling Wedge Breakout
Current Price: \$2.962
Target Price: \$3.70
Target % Gain: 20.27%
Technical Analysis: GAS has broken out of a falling wedge on the 4H chart, signaling bullish momentum. Price is retesting the breakout zone with a potential push towards \$3.70. Volume support and structure indicate continuation.
Time Frame: 4H
Risk Management Tip: Always use proper risk management.
🚀🔥Your gateway to expert crypto insights, signals & strategies! 📊💰
Join our Telegram for real-time market updates & profitable opportunities! 📈🔔
👇 Stay ahead in the crypto game 👇
👇👇👇👇👇👇
linktr.ee/CryptoWithJames
Join our Telegram for real-time market updates & profitable opportunities! 📈🔔
👇 Stay ahead in the crypto game 👇
👇👇👇👇👇👇
linktr.ee/CryptoWithJames
Disclaimer
The information and publications are not meant to be, and do not constitute, financial, investment, trading, or other types of advice or recommendations supplied or endorsed by TradingView. Read more in the Terms of Use.