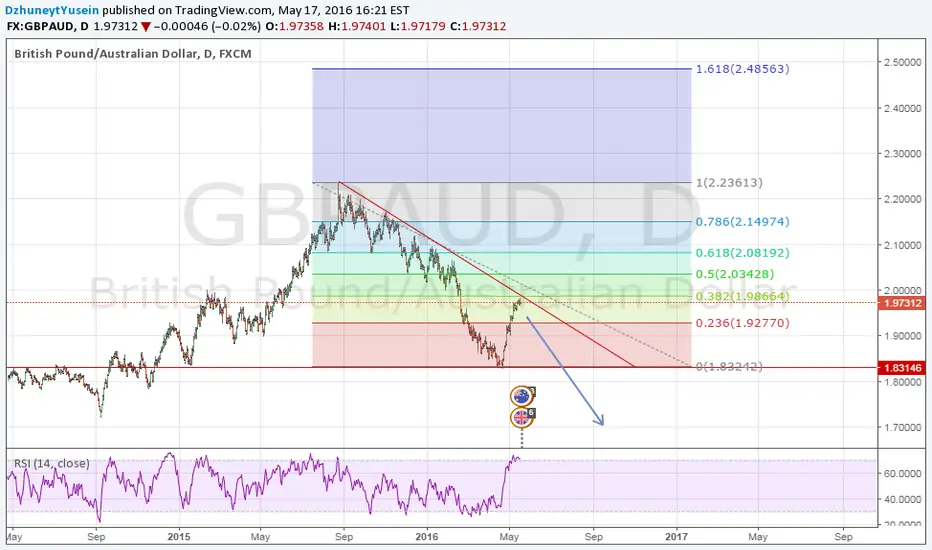
GBPAUD currently hitting resistance line of a bearish trend since September last year.
Taking Fibonacci from the highest point of the current trend (in August last year) and lowest point from April this yea), it hits 0.3 Fib level.
Structure + 0.3 Fib + Over-bought daily chart, all indicate short.
Good luck!
Taking Fibonacci from the highest point of the current trend (in August last year) and lowest point from April this yea), it hits 0.3 Fib level.
Structure + 0.3 Fib + Over-bought daily chart, all indicate short.
Good luck!
Disclaimer
The information and publications are not meant to be, and do not constitute, financial, investment, trading, or other types of advice or recommendations supplied or endorsed by TradingView. Read more in the Terms of Use.
Disclaimer
The information and publications are not meant to be, and do not constitute, financial, investment, trading, or other types of advice or recommendations supplied or endorsed by TradingView. Read more in the Terms of Use.