Hey traders, hope you’re crushing it this week! 🚀
Just spotted a clean ABC Bullish setup on the GBP/AUD 1-Hour chart. Here’s the breakdown:
🧠 Pattern Breakdown
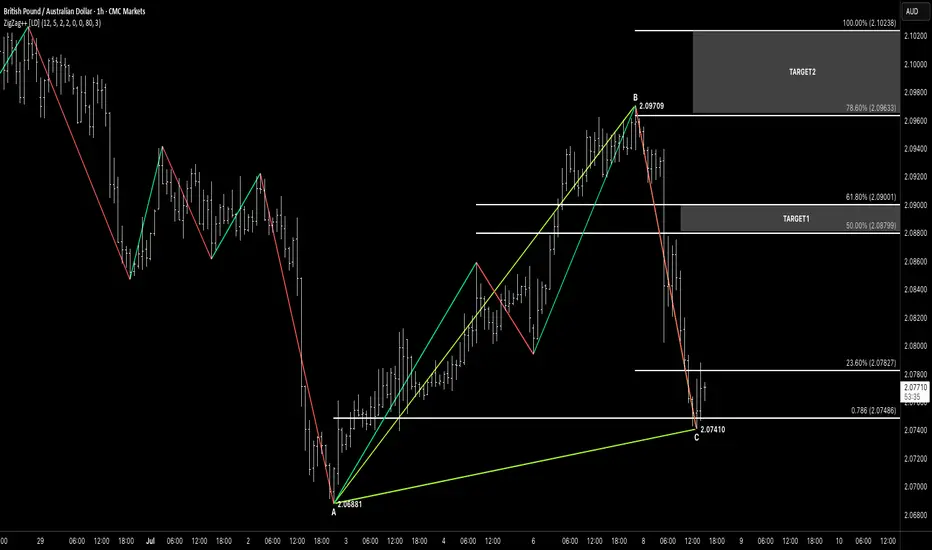
A→B (Impulse Up): 2.06881 → 2.09709
B→C (Retrace Down): 2.09709 → 2.07410
Point C landed right on our rising A→C trendline and just under the 78.6% Fib of A→B (~2.07486)—double confluence!
✅ Why This Works
ABC Structure: Clear impulse then corrective leg into support
Trendline Support: A→C line guiding our C pivot
Fib Confluence: C sits in the 23.6%–78.6% zone of A→B (2.07827–2.07486)
⚔️ Trade Plan
Entry: Long after an hourly close above 2.07827 (23.6% level), ideally within 2.07827–2.07410 (PCZ)
Stop-Loss: Just below point C at 2.07410 (e.g. 2.07380)
Size: Keep risk sensible—1–2% of your account
🎯 Profit Targets
T1: 50% retrace of B→C → 2.08799 (take partial)
T2: 61.8% retrace → 2.09001
T3: 78.6% retrace → 2.09633–2.10238
🔍 Confirmation & Invalidation
Confirm: Look for a bullish pin-bar or engulfing candle closing above 2.07827 before entering
Invalidate: If price dips below 2.07410 (point C), scrap the idea—this setup needs that level to hold
💡 Keep It Simple:
ABC → PCZ → 23.6% close → Trigger → Ride.
Let the chart guide you, not your emotions, and watch for any GBP/AUD news for extra context.
Here’s to tight stops, smart entries, and smooth profits! ✌️
Just spotted a clean ABC Bullish setup on the GBP/AUD 1-Hour chart. Here’s the breakdown:
🧠 Pattern Breakdown
A→B (Impulse Up): 2.06881 → 2.09709
B→C (Retrace Down): 2.09709 → 2.07410
Point C landed right on our rising A→C trendline and just under the 78.6% Fib of A→B (~2.07486)—double confluence!
✅ Why This Works
ABC Structure: Clear impulse then corrective leg into support
Trendline Support: A→C line guiding our C pivot
Fib Confluence: C sits in the 23.6%–78.6% zone of A→B (2.07827–2.07486)
⚔️ Trade Plan
Entry: Long after an hourly close above 2.07827 (23.6% level), ideally within 2.07827–2.07410 (PCZ)
Stop-Loss: Just below point C at 2.07410 (e.g. 2.07380)
Size: Keep risk sensible—1–2% of your account
🎯 Profit Targets
T1: 50% retrace of B→C → 2.08799 (take partial)
T2: 61.8% retrace → 2.09001
T3: 78.6% retrace → 2.09633–2.10238
🔍 Confirmation & Invalidation
Confirm: Look for a bullish pin-bar or engulfing candle closing above 2.07827 before entering
Invalidate: If price dips below 2.07410 (point C), scrap the idea—this setup needs that level to hold
💡 Keep It Simple:
ABC → PCZ → 23.6% close → Trigger → Ride.
Let the chart guide you, not your emotions, and watch for any GBP/AUD news for extra context.
Here’s to tight stops, smart entries, and smooth profits! ✌️
Disclaimer
The information and publications are not meant to be, and do not constitute, financial, investment, trading, or other types of advice or recommendations supplied or endorsed by TradingView. Read more in the Terms of Use.
Disclaimer
The information and publications are not meant to be, and do not constitute, financial, investment, trading, or other types of advice or recommendations supplied or endorsed by TradingView. Read more in the Terms of Use.