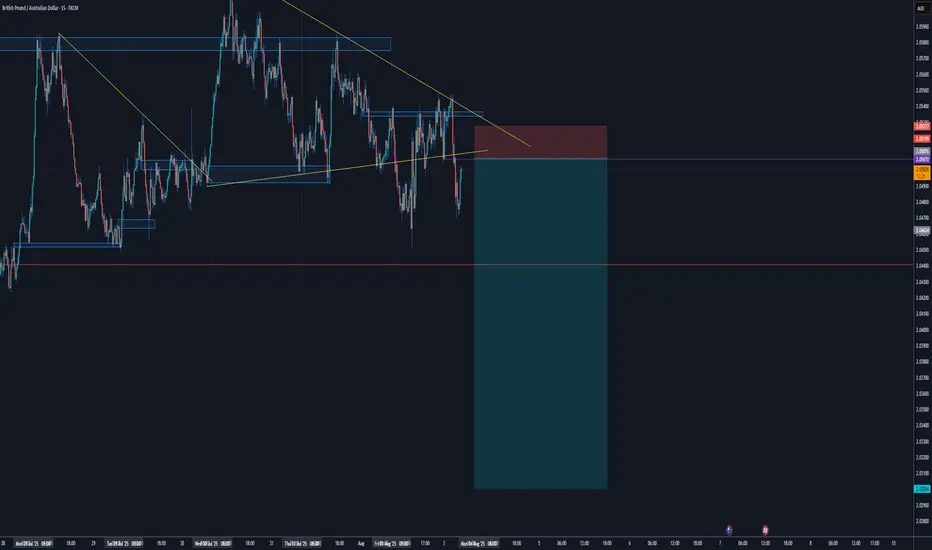
🎯 1. Resistance at Trendline & Horizontal Zone
The price is touching a descending trendline (in yellow), coupled with a horizontal resistance zone (light-blue/boxed) just above.
This area acted as support earlier and now has flipped to resistance—classic supply–resistance confluence.
2. Structure Shift – Lower High Forming
The most recent swing high is lower than the previous peak, indicating weakening momentum and possible shift into a downtrend.
Market structure aligns in favor of sellers.
3. Trendline Rejection (Backtest)
The price attempted to breach the descending line but failed and pulled back below it.
Indicates lack of bullish conviction and a likely continuation downward.
4. Risk–Reward Zone
The red zone indicates your stop-loss placed just above the resistance zone/trendline confluence — a tight and logical level.
The large blue rectangle below represents your potential profit target — good R:R.
In essence, you're risking small for a larger reward.
5. Confirmation via Price Action
Notice the recent wick-up into resistance followed by bearish rejection (candles showing rejections).
This is a typical reversal signal at a strong confluence area.
Disclaimer
The information and publications are not meant to be, and do not constitute, financial, investment, trading, or other types of advice or recommendations supplied or endorsed by TradingView. Read more in the Terms of Use.
Disclaimer
The information and publications are not meant to be, and do not constitute, financial, investment, trading, or other types of advice or recommendations supplied or endorsed by TradingView. Read more in the Terms of Use.