GBPAUD 4H Rocket Boost Strategy – Strong Bullish Structure with EMA Support, Breakout Momentum, ADX Trend Power, and Stoch RSI Buy Signal
The GBPAUD currency pair has set up a compelling bullish scenario on the 4-hour chart, closely fitting the Rocket Boost
Strategy framework. This setup is a powerful combination of trend-following confirmation and momentum-based signals that
many experienced traders look for before entering high-probability trades.
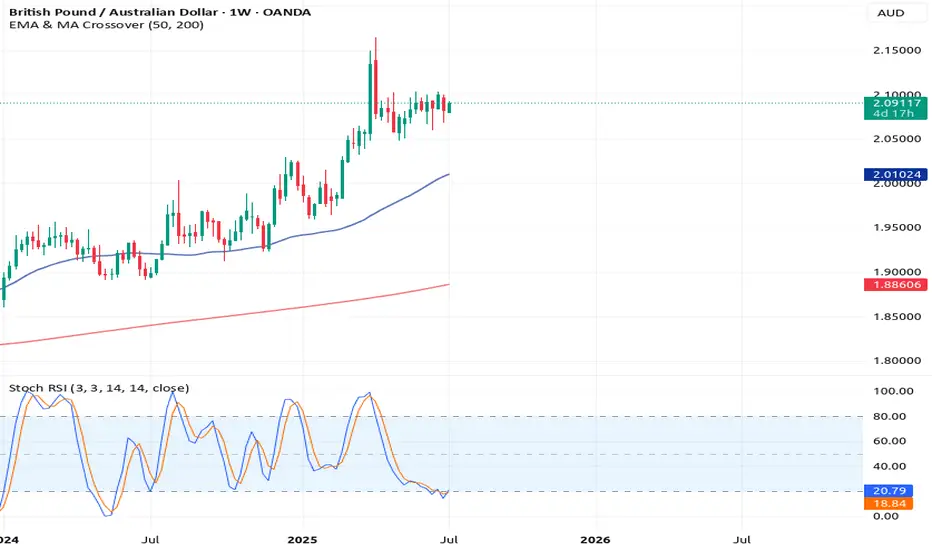
1. Price Above the 50 EMA
GBPAUD is currently holding above the 50-period Exponential Moving Average, which shows short-term bullish control. This
EMA is often used to track immediate price direction, and when \
price consistently remains above it, it suggests strong buying
interest is supporting each pullback. Recent candles have respected the 50 EMA as dynamic support, indicating a solid
foundation for continued upside movement.
2. Price Above the 200 EMA
The 200 EMA is widely viewed as the "line in the sand" between
bullish and bearish bias on higher timeframes. With GBPAUD trading above this level, long-term sentiment confirms that the
market favors the bulls. The 50 EMA sitting above the 200 EMA
also forms a bullish stack, adding even more weight to the long
setup. This dual EMA alignment acts like a runway for bullish continuation.
3. Breakout Candles / Aggressive Price Action
Recent price movement shows a series of strong bullish candles with higher closes and minimal lower wicks. These breakout-style candles reflect aggressive buying, often seen when
institutional orders are flowing into the market. This type of behavior, especially when occurring above both EMAs, is
considered part of the Rocket Boost ignition point—a moment when price accelerates beyond previous resistance without hesitation.
4. ADX Indicator Confirms Trend Strength
The Average Directional Index (ADX) is showing rising values above the 20–25 zone, which signals that the current trend is not
only present but gaining strength. When price action and moving averages align with a rising ADX, it suggests that the trend has
the potential to continue with strong momentum. This increases
the confidence in the breakout being sustainable rather than a false move.
5. Stochastic RSI Generates Fresh Buy Signal
The Stochastic RSI recently moved from oversold levels and has now crossed upward, giving a fresh buy signal just as the
breakout begins. This timing is key—it tells us that momentum is turning in favor of the bulls just as the trend is gaining steam.
When this signal aligns with EMA structure and ADX confirmation, it often acts as a launch pad for the next leg up.
What This Means for GBPAUD Traders
With price trading above both EMAs, strong breakout candles forming, a rising ADX, and a bullish Stochastic RSI cross, the
GBPAUD pair is showing every characteristic of a classic Rocket Boost setup. Traders may want to monitor upcoming resistance
zones—especially previous swing highs and psychological levels—for potential targets.
If momentum continues and volume supports the move, we could see GBPAUD make a strong climb in the coming sessions.
Managing entries and exits around minor pullbacks, Fibonacci extensions, or intraday support zones can help optimize trade outcomes.
To learn more about this kind of setup, search for Rocket Booster Strategy content.
Disclaimer: This article is for educational purposes only and is not financial advice. Always perform your own analysis, and use risk management when trading.
The GBPAUD currency pair has set up a compelling bullish scenario on the 4-hour chart, closely fitting the Rocket Boost
Strategy framework. This setup is a powerful combination of trend-following confirmation and momentum-based signals that
many experienced traders look for before entering high-probability trades.
1. Price Above the 50 EMA
GBPAUD is currently holding above the 50-period Exponential Moving Average, which shows short-term bullish control. This
EMA is often used to track immediate price direction, and when \
price consistently remains above it, it suggests strong buying
interest is supporting each pullback. Recent candles have respected the 50 EMA as dynamic support, indicating a solid
foundation for continued upside movement.
2. Price Above the 200 EMA
The 200 EMA is widely viewed as the "line in the sand" between
bullish and bearish bias on higher timeframes. With GBPAUD trading above this level, long-term sentiment confirms that the
market favors the bulls. The 50 EMA sitting above the 200 EMA
also forms a bullish stack, adding even more weight to the long
setup. This dual EMA alignment acts like a runway for bullish continuation.
3. Breakout Candles / Aggressive Price Action
Recent price movement shows a series of strong bullish candles with higher closes and minimal lower wicks. These breakout-style candles reflect aggressive buying, often seen when
institutional orders are flowing into the market. This type of behavior, especially when occurring above both EMAs, is
considered part of the Rocket Boost ignition point—a moment when price accelerates beyond previous resistance without hesitation.
4. ADX Indicator Confirms Trend Strength
The Average Directional Index (ADX) is showing rising values above the 20–25 zone, which signals that the current trend is not
only present but gaining strength. When price action and moving averages align with a rising ADX, it suggests that the trend has
the potential to continue with strong momentum. This increases
the confidence in the breakout being sustainable rather than a false move.
5. Stochastic RSI Generates Fresh Buy Signal
The Stochastic RSI recently moved from oversold levels and has now crossed upward, giving a fresh buy signal just as the
breakout begins. This timing is key—it tells us that momentum is turning in favor of the bulls just as the trend is gaining steam.
When this signal aligns with EMA structure and ADX confirmation, it often acts as a launch pad for the next leg up.
What This Means for GBPAUD Traders
With price trading above both EMAs, strong breakout candles forming, a rising ADX, and a bullish Stochastic RSI cross, the
GBPAUD pair is showing every characteristic of a classic Rocket Boost setup. Traders may want to monitor upcoming resistance
zones—especially previous swing highs and psychological levels—for potential targets.
If momentum continues and volume supports the move, we could see GBPAUD make a strong climb in the coming sessions.
Managing entries and exits around minor pullbacks, Fibonacci extensions, or intraday support zones can help optimize trade outcomes.
To learn more about this kind of setup, search for Rocket Booster Strategy content.
Disclaimer: This article is for educational purposes only and is not financial advice. Always perform your own analysis, and use risk management when trading.
Related publications
Disclaimer
The information and publications are not meant to be, and do not constitute, financial, investment, trading, or other types of advice or recommendations supplied or endorsed by TradingView. Read more in the Terms of Use.
Related publications
Disclaimer
The information and publications are not meant to be, and do not constitute, financial, investment, trading, or other types of advice or recommendations supplied or endorsed by TradingView. Read more in the Terms of Use.