**Description:**
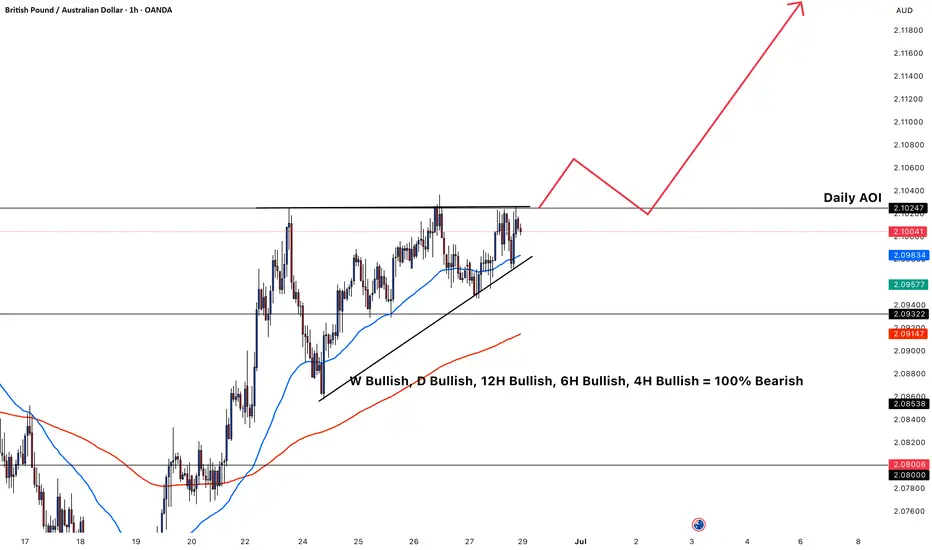
This is a 1-hour chart of **GBP/AUD** showing a clear bullish market structure. Price is currently consolidating just below a horizontal resistance zone (around 2.1025), forming **higher lows** with an ascending trendline. This suggests **pressure building for a breakout**.
All higher timeframes (Weekly, Daily, 12H, 6H, 4H) are showing bullish momentum. The price is also trading above both the **50 EMA (blue)** and **200 EMA (red)**, confirming a bullish environment.
There is a marked **Daily Area of Interest (AOI)** just above current price, which aligns with a breakout and retest pattern scenario drawn in red.
---
**Why I want to enter a Buy:**
* ✅ **Bullish trend on all major timeframes (W, D, 12H, 6H, 4H)** — strong momentum support.
* ✅ **Ascending triangle pattern** suggests a breakout is likely.
* ✅ **Price above 50 and 200 EMA** — confirms short- and long-term bullish structure.
* ✅ **Liquidity resting above resistance** — possible stop hunt or breakout target.
* ✅ **Breakout and retest setup** expected near the Daily AOI (around 2.1025–2.1040), with upside potential toward 2.11800.
I’m waiting for either:
1. A **clean breakout and retest** of the 2.1025 zone; or
2. A **strong breakout candle** through resistance to enter with momentum.
🎯 **Target:** 2.11800
🛡️ **Stop loss:** Below trendline or EMA (e.g., under 2.0957)
Trade active
100% Bullish the trendDisclaimer
The information and publications are not meant to be, and do not constitute, financial, investment, trading, or other types of advice or recommendations supplied or endorsed by TradingView. Read more in the Terms of Use.
Disclaimer
The information and publications are not meant to be, and do not constitute, financial, investment, trading, or other types of advice or recommendations supplied or endorsed by TradingView. Read more in the Terms of Use.