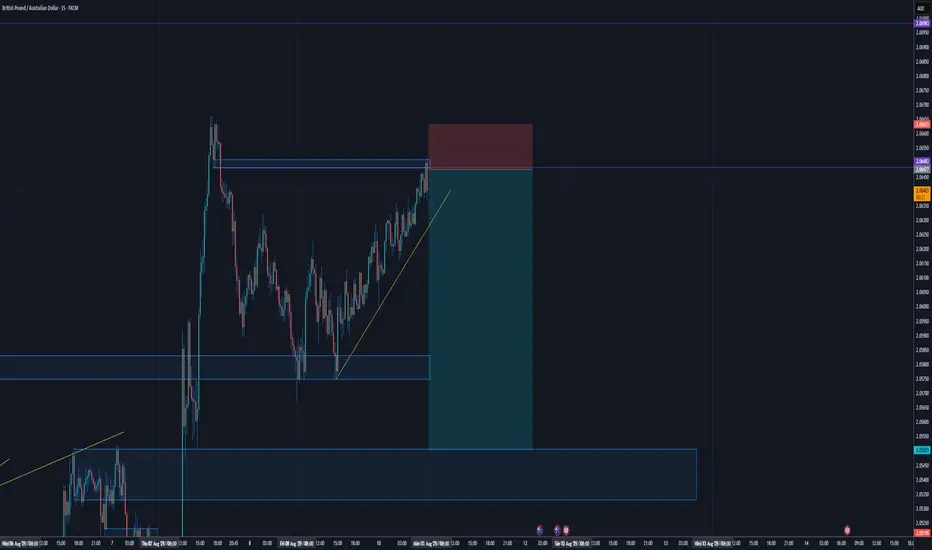
1. Price Hitting a Strong Horizontal Resistance Zone
You're seeing price approach and test a clearly defined horizontal resistance area—likely where price previously reversed. Swing highs tend to act as barriers, where sellers often re-enter the market. Price action suggests resistance is holding again, making a downturn more probable next. This aligns with how support/resistance zones work in technical analysis.
Investopedia
Wikipedia
2. Rising Wedge or Upward Trendline Break
You've drawn an ascending trendline beneath recent lows to highlight an uptrend. The approaching resistance combined with a potential break of that trendline increases the probability of trend reversal or at least a strong pullback. Trendline acts as support; its failure often signals a reversal.
Enrich Money
Wikipedia
3. Trendline Becomes Resistance After Break
If price were to break below and then retest your trendline (or horizontal level) but still fail to move back above, that reinforces it as a new resistance. A common short-entry tactic is entering upon such rejection—entry point, stop above the level, tight risk, favorable reward.
Investopedia
+15
Enrich Money
+15
Investopedia
+15
4. Potential False Breaks—Volume Confirmation Needed
If you’re seeing wicks that flirt with resistance before retreating, that might be a false breakout—or a “fakey”—which often precedes stronger moves in the opposite direction. Volume confirmation or lack thereof can be especially telling: a spike on peak rejection supports a short bias.
priceaction.com
Investopedia
5. Risk-Reward is Solid
Your shaded areas suggest a disciplined trade: small stop loss just above resistance, and a larger profit target range below—it’s a classic risk/reward setup. That’s the essence of good breakout or reversal trading discipline.
streak.tech
+6
luxalgo.com
+6
investors.com
+6
Summary in a Nutshell:
You're shorting here because:
Price is repeatedly respecting a key horizontal resistance.
There's the threat of a trendline breakdown.
A retest and rejection would confirm the trend’s shift.
Volume or price action signals at that level suggest sellers are in control.
The risk/reward ratio is favorable—tight stop, big target.
Disclaimer
The information and publications are not meant to be, and do not constitute, financial, investment, trading, or other types of advice or recommendations supplied or endorsed by TradingView. Read more in the Terms of Use.
Disclaimer
The information and publications are not meant to be, and do not constitute, financial, investment, trading, or other types of advice or recommendations supplied or endorsed by TradingView. Read more in the Terms of Use.