Hello Traders
Here's a breakdown on GBPAUD: Daily Timeframe
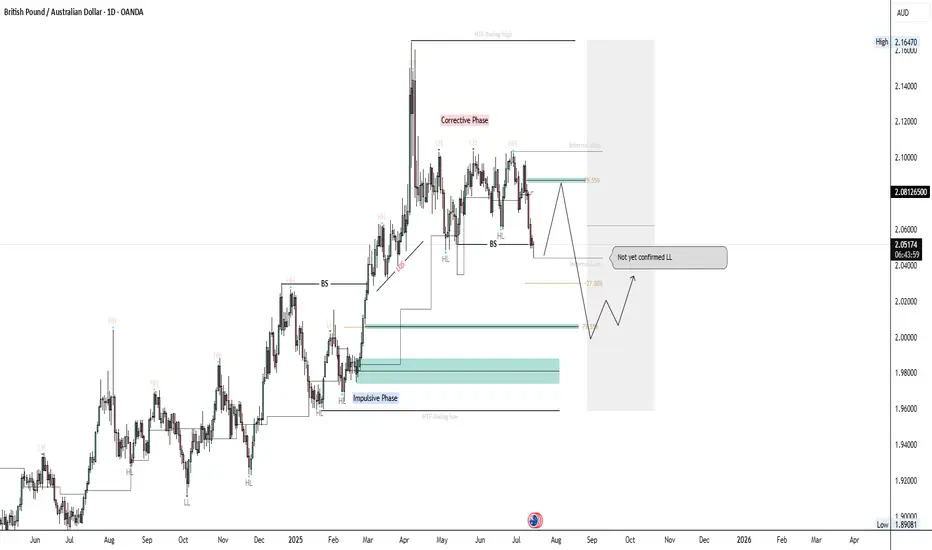
1. Overall trend is bullish; price has been consistently forming HH & respecting HL.
2. Current price is in corrective phase, meaning we should be focusing on sells until we reach our discounted level, and price will be following bearish order flow (Forming LL & respecting LH)
3. Using the identified swing high and swing low, we can place our Fibonacci to identify discounted prices where we can look for possible longs again.
4. Until then we can identify internal swing low and swing high using the H4 timeframe, and we can identify premium levels to look for potential short positions (Counter trend trade) as illustrated.
Here's a breakdown on GBPAUD: Daily Timeframe
1. Overall trend is bullish; price has been consistently forming HH & respecting HL.
2. Current price is in corrective phase, meaning we should be focusing on sells until we reach our discounted level, and price will be following bearish order flow (Forming LL & respecting LH)
3. Using the identified swing high and swing low, we can place our Fibonacci to identify discounted prices where we can look for possible longs again.
4. Until then we can identify internal swing low and swing high using the H4 timeframe, and we can identify premium levels to look for potential short positions (Counter trend trade) as illustrated.
Disclaimer
The information and publications are not meant to be, and do not constitute, financial, investment, trading, or other types of advice or recommendations supplied or endorsed by TradingView. Read more in the Terms of Use.
Disclaimer
The information and publications are not meant to be, and do not constitute, financial, investment, trading, or other types of advice or recommendations supplied or endorsed by TradingView. Read more in the Terms of Use.