"GBPAUD Daily Outlook – Key Support at 2.05, Bearish Breakdown
I see you are analyzing the GBPAUD (British Pound / Australian Dollar) chart on the daily timeframe (1D). Let’s break it down:
---
1. Chart Pattern (Structure)
From your screenshot:
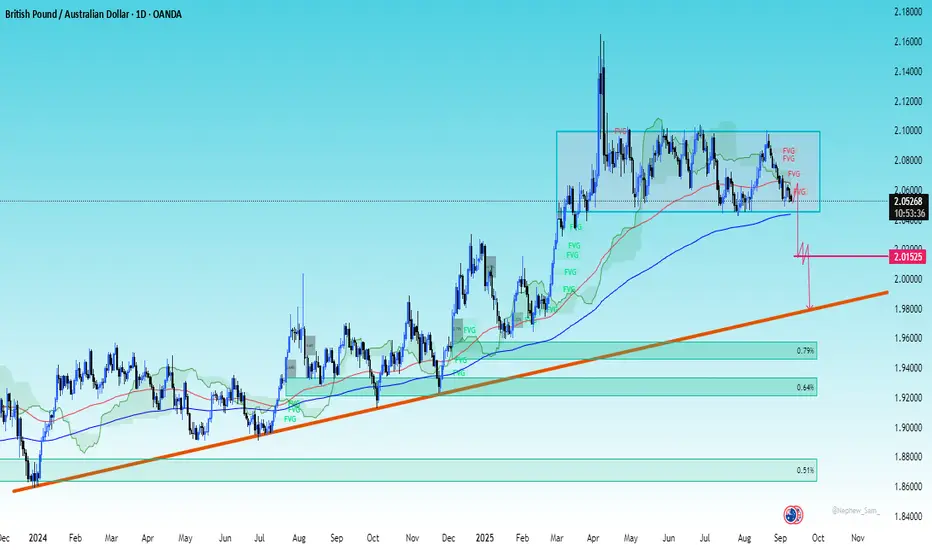
Price is consolidating inside a range/rectangle (sideways market) between roughly 2.02 – 2.10.
Currently, price is testing the lower range support around 2.05.
If the range breaks downward, it could form a distribution pattern / rectangle breakout (bearish continuation).
---
2. Support & Resistance Levels
Immediate resistance: 2.07 – 2.08 (mid-range & EMA resistance).
Strong resistance: 2.10 – 2.12 (top of the range).
Immediate support: 2.04 – 2.05 (bottom of the range).
Next support: 2.0150 (red line marked in your chart).
Major support: 2.00 psychological level, then 1.9750 – 1.9600 (Fibonacci zones shown on your chart).
---
3. Target Zones (if bearish breakout happens)
First target: 2.0150 (previous horizontal level).
Second target: 2.00 (psychological round number).
Third target (swing): 1.9750 – 1.9600 (Fibonacci 0.618 zone).
---
4. Stop Loss
If you are taking a short/sell trade, the stop loss should be above the recent swing high inside the range:
Safe SL: 2.08 – 2.085 (above range resistance).
---
✅ Summary (Daily Chart – GBPAUD)
Pattern: Sideways range / rectangle, potential bearish breakout.
Entry idea: Sell on breakdown below 2.045 – 2.05 zone.
Target 1: 2.0150
Target 2: 2.00
Target 3: 1.9750 – 1.9600
Stop loss: Above 2.08
---
⚠ Note: If price bounces strongly from 2.05, then we may see another push back toward 2.08 – 2.10, so watch for confirmation before entry.
Do you want me to give you a bullish alternative scenario also (in case support holds at 2.05)?
---
1. Chart Pattern (Structure)
From your screenshot:
Price is consolidating inside a range/rectangle (sideways market) between roughly 2.02 – 2.10.
Currently, price is testing the lower range support around 2.05.
If the range breaks downward, it could form a distribution pattern / rectangle breakout (bearish continuation).
---
2. Support & Resistance Levels
Immediate resistance: 2.07 – 2.08 (mid-range & EMA resistance).
Strong resistance: 2.10 – 2.12 (top of the range).
Immediate support: 2.04 – 2.05 (bottom of the range).
Next support: 2.0150 (red line marked in your chart).
Major support: 2.00 psychological level, then 1.9750 – 1.9600 (Fibonacci zones shown on your chart).
---
3. Target Zones (if bearish breakout happens)
First target: 2.0150 (previous horizontal level).
Second target: 2.00 (psychological round number).
Third target (swing): 1.9750 – 1.9600 (Fibonacci 0.618 zone).
---
4. Stop Loss
If you are taking a short/sell trade, the stop loss should be above the recent swing high inside the range:
Safe SL: 2.08 – 2.085 (above range resistance).
---
✅ Summary (Daily Chart – GBPAUD)
Pattern: Sideways range / rectangle, potential bearish breakout.
Entry idea: Sell on breakdown below 2.045 – 2.05 zone.
Target 1: 2.0150
Target 2: 2.00
Target 3: 1.9750 – 1.9600
Stop loss: Above 2.08
---
⚠ Note: If price bounces strongly from 2.05, then we may see another push back toward 2.08 – 2.10, so watch for confirmation before entry.
Do you want me to give you a bullish alternative scenario also (in case support holds at 2.05)?
im professional forex and crypto trader im providing signals join me on telegram
t.me/GoldRoyalTrader15
t.me/GoldRoyalTrader15
Related publications
Disclaimer
The information and publications are not meant to be, and do not constitute, financial, investment, trading, or other types of advice or recommendations supplied or endorsed by TradingView. Read more in the Terms of Use.