Trend Context:
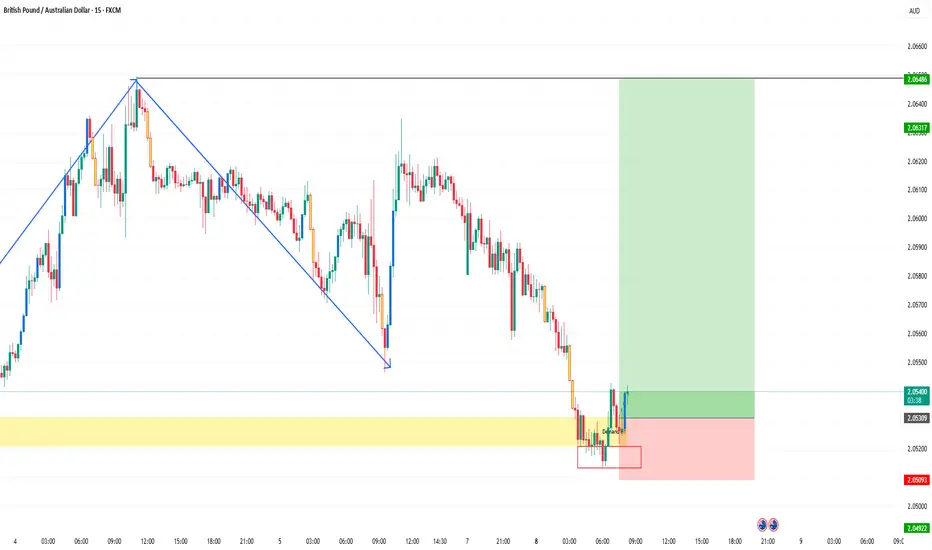
Price had a sharp bearish move after forming a swing high (left side with blue zigzag).
The downtrend has been consistent with lower highs and lower lows.
Demand Zone
The yellow zone marks a demand/support area where buyers stepped in before.
Price tested this area multiple times and wicked down into the red rectangle, showing rejection.
Entry Setup
You entered around 2.0534 after price reacted strongly from the demand zone.
Stop loss (SL): 2.0492 (below the demand rejection area). Take profit (TP): 2.0648 (at previous supply/structure level).
Risk-to-Reward (RR)
Approximate RR ≈ 3.5:1 → strong risk-to-reward setup. This means if the trade wins, the reward is about 3.5x the risk.
Bullish Signs
Demand zone held firmly. Small consolidation inside red box → accumulation before breakout.
Buyers are showing strength with rejection wicks.
Bearish Risks
Overall market structure is still bearish (downtrend). If buyers fail to push above 2.0550–2.0560, sellers may re-enter. A break below 2.0490 would invalidate the bullish setup.
This is a counter-trend long trade from demand. If bullish momentum sustains above 2.0560, TP is realistic. But since the higher trend is bearish, manage risk strictly.
👉 Safer play: trail SL once price moves above 2.0570–2.0580.
Disclaimer
The information and publications are not meant to be, and do not constitute, financial, investment, trading, or other types of advice or recommendations supplied or endorsed by TradingView. Read more in the Terms of Use.
Disclaimer
The information and publications are not meant to be, and do not constitute, financial, investment, trading, or other types of advice or recommendations supplied or endorsed by TradingView. Read more in the Terms of Use.