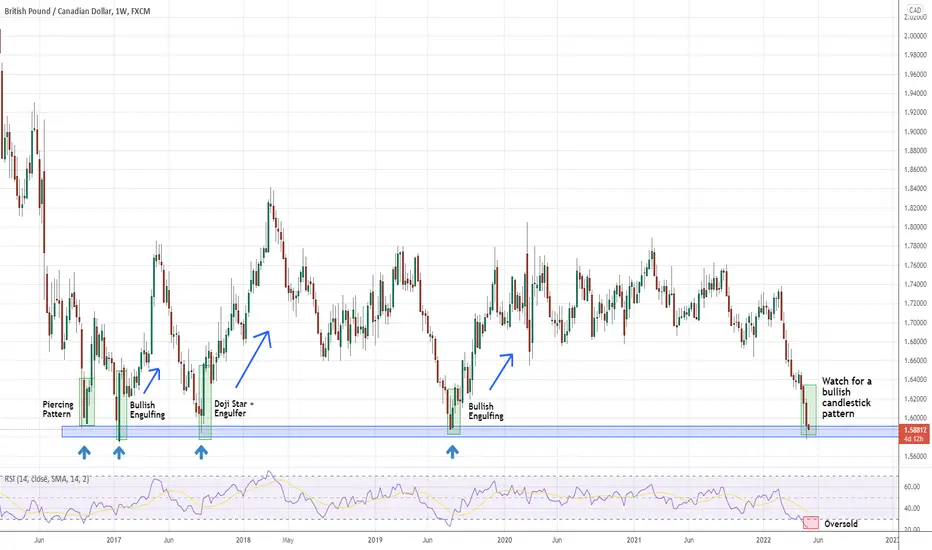
Since 2016, GBPCAD has been moving in a wide horizontal channel. Recently, GBPCAD has reached the bottom of the range at the level of 1.5900. We can clearly see that many reversals have occurred from this level. Observing the weekly chart, reversals have all occurred through forming clear bullish candlestick patterns. Therefore, we are currently waiting to see a bullish candlestick pattern being formed. If formed, this could give us a high probability swing buy opportunity.
Disclaimer
The information and publications are not meant to be, and do not constitute, financial, investment, trading, or other types of advice or recommendations supplied or endorsed by TradingView. Read more in the Terms of Use.
Disclaimer
The information and publications are not meant to be, and do not constitute, financial, investment, trading, or other types of advice or recommendations supplied or endorsed by TradingView. Read more in the Terms of Use.