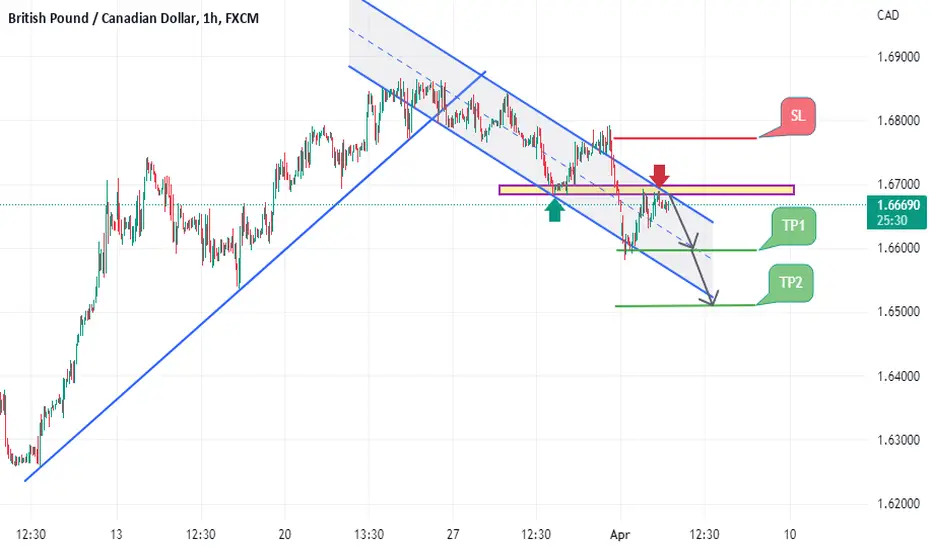
Hello traders, we want to check the GBPCAD chart in the 1-hour time frame. After breaking the upward trend line, the price is moving in a downward channel. After breaking the previous floor, the price has pulled back towards it again. It plays a resistance level and the price continues to fall until the specified targets. Good luck.
GBPCAD sell Entry : 1.66838
Stop : 1.67714 , Target1 : 1.65962 , Target2 : 1.65086
Risk/Reward Ratio : 2
GBPCAD sell Entry : 1.66838
Stop : 1.67714 , Target1 : 1.65962 , Target2 : 1.65086
Risk/Reward Ratio : 2
Disclaimer
The information and publications are not meant to be, and do not constitute, financial, investment, trading, or other types of advice or recommendations supplied or endorsed by TradingView. Read more in the Terms of Use.
Disclaimer
The information and publications are not meant to be, and do not constitute, financial, investment, trading, or other types of advice or recommendations supplied or endorsed by TradingView. Read more in the Terms of Use.