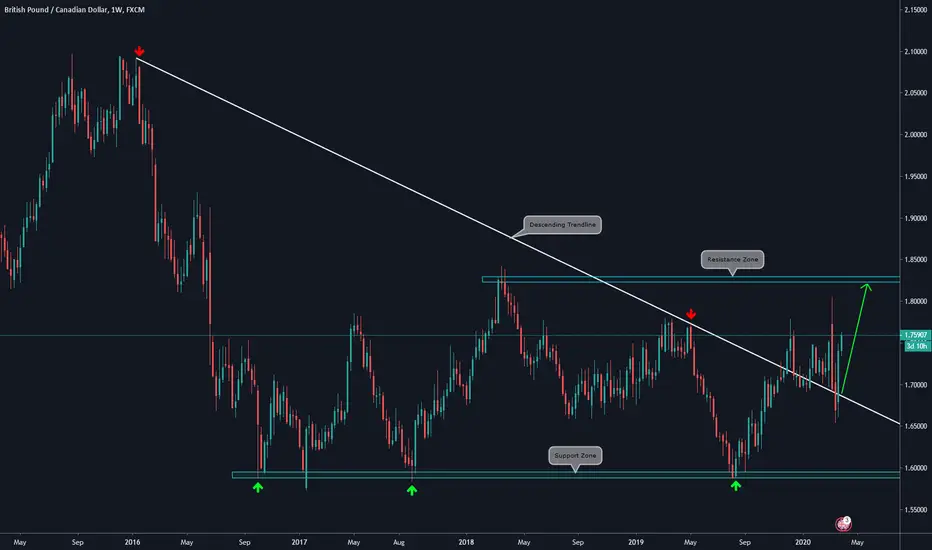
🔸 Weekly Chart Explanation:
.
.
🔸 Price broke the Descending Trendline.
.
🔸 After some weeks, it did a pullback towards the broken trendline.
.
🔸 There was a strong rejection, so, we consider it has potential to reach the Resistance Zone.
.
🔸 We will look for a lower timeframe bullish setup.
🔸DAILY CHART ANALYSIS:

.
.
🔸 Price broke the Descending Trendline.
.
🔸 After some weeks, it did a pullback towards the broken trendline.
.
🔸 There was a strong rejection, so, we consider it has potential to reach the Resistance Zone.
.
🔸 We will look for a lower timeframe bullish setup.
🔸DAILY CHART ANALYSIS:
Disclaimer
The information and publications are not meant to be, and do not constitute, financial, investment, trading, or other types of advice or recommendations supplied or endorsed by TradingView. Read more in the Terms of Use.
Disclaimer
The information and publications are not meant to be, and do not constitute, financial, investment, trading, or other types of advice or recommendations supplied or endorsed by TradingView. Read more in the Terms of Use.