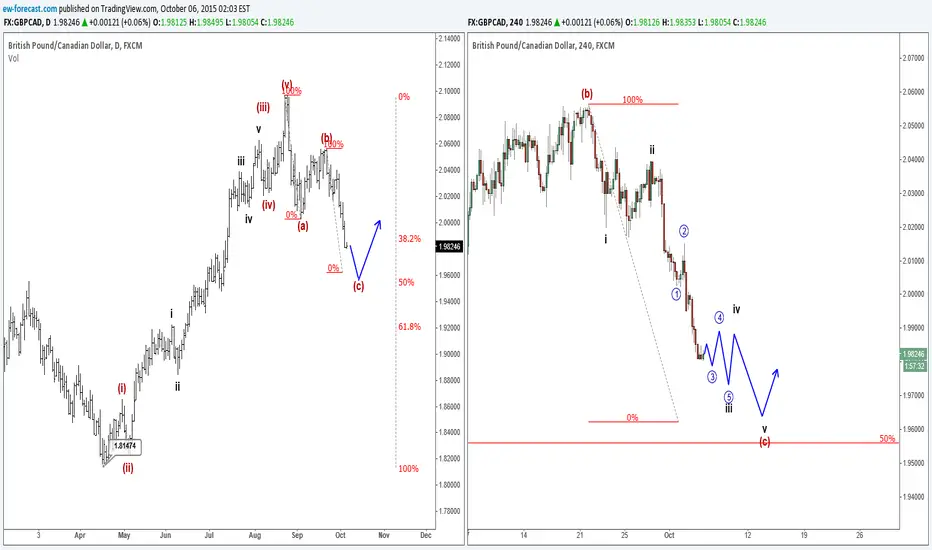
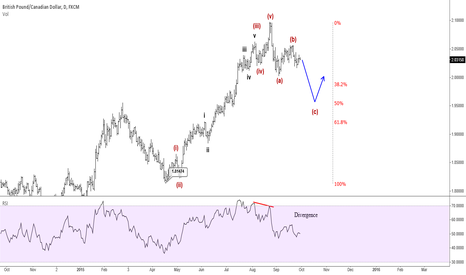
On the Daily chart of GBPCAD, we see a nice bullish cycle from April lows. It looks like trend made a top as in red wave (v) and now we expect the price to make a three wave retracement.
Red waves (a) and (b) seems to be completed, because of a sharp fall to the downside into a red wave (c), which should have an impulsive structure, that means five waves down, that we are tracking on 4h chart. Ideally price will continue to around 1.9600 - 1.9700 area, where even our fibo. level 50% of a previous big five waves up shown on the Daily chart can react as a support.
Link to our previous posts about this pair:
ew-forecast.com
US Single STOCKS (FREE Access), FX, Crypto
👉Explore Our Services @ wavetraders.com/elliott-wave-plans/
Learn Elliott Waves
👉 wavetraders.com/academy/
Newsletter Sign up
👉 bit.ly/3FVPVzO
👉Explore Our Services @ wavetraders.com/elliott-wave-plans/
Learn Elliott Waves
👉 wavetraders.com/academy/
Newsletter Sign up
👉 bit.ly/3FVPVzO
Disclaimer
The information and publications are not meant to be, and do not constitute, financial, investment, trading, or other types of advice or recommendations supplied or endorsed by TradingView. Read more in the Terms of Use.