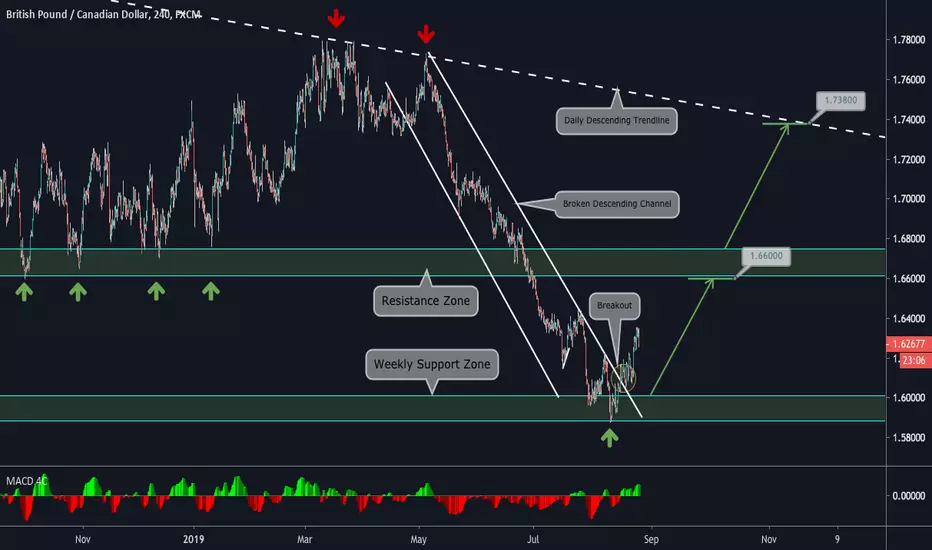
4 Hour Chart Explanation:
- Price was on a Descending Channel.
- It bounced on the Weekly Support Zone and broke it.
- Now, it has potential to move up towards the Resistance Zone at 1.66 and, then, if the up move continues, towards the Daily Descending Trendline at 1.738.
- We are looking for Buy Setups on lower timeframes to trade this instrument.
Check out our Weekly and Daily Vision, but also our last prediction on this instrument on the Related Ideas.
Weekly Vision:

Daily Vision:

Updates coming soon!
- Price was on a Descending Channel.
- It bounced on the Weekly Support Zone and broke it.
- Now, it has potential to move up towards the Resistance Zone at 1.66 and, then, if the up move continues, towards the Daily Descending Trendline at 1.738.
- We are looking for Buy Setups on lower timeframes to trade this instrument.
Check out our Weekly and Daily Vision, but also our last prediction on this instrument on the Related Ideas.
Weekly Vision:
Daily Vision:
Updates coming soon!
Related publications
Disclaimer
The information and publications are not meant to be, and do not constitute, financial, investment, trading, or other types of advice or recommendations supplied or endorsed by TradingView. Read more in the Terms of Use.
Related publications
Disclaimer
The information and publications are not meant to be, and do not constitute, financial, investment, trading, or other types of advice or recommendations supplied or endorsed by TradingView. Read more in the Terms of Use.