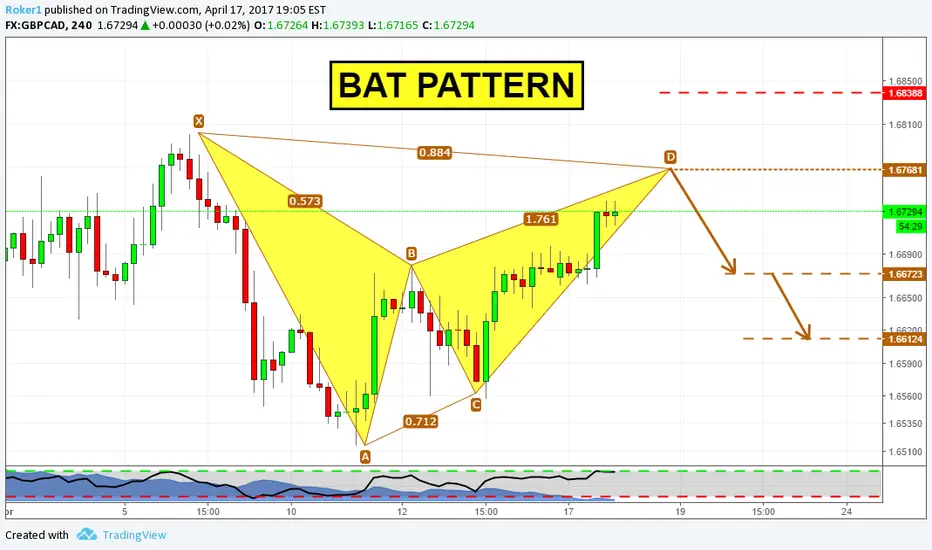
Hi guys, on the daily chart on GBPCAD you can see price is bouncing back and forth between two levels of structure. In consolidation periods like this it's quite frequent to see harmonic patterns unfolding. I think this could be a nice trade.
Stops above X, targets as usuale for patterns.
If you have questions, or simply share your view, you're welcome in the comment section below.
Otherwise, see you in the next chart!
Stops above X, targets as usuale for patterns.
If you have questions, or simply share your view, you're welcome in the comment section below.
Otherwise, see you in the next chart!
Trade active
Trade closed: stop reached
Stop reached, even though if i was in front of my pc this would have been a breakeven trade, since price got very near to the target1 (2 pips).Disclaimer
The information and publications are not meant to be, and do not constitute, financial, investment, trading, or other types of advice or recommendations supplied or endorsed by TradingView. Read more in the Terms of Use.
Disclaimer
The information and publications are not meant to be, and do not constitute, financial, investment, trading, or other types of advice or recommendations supplied or endorsed by TradingView. Read more in the Terms of Use.