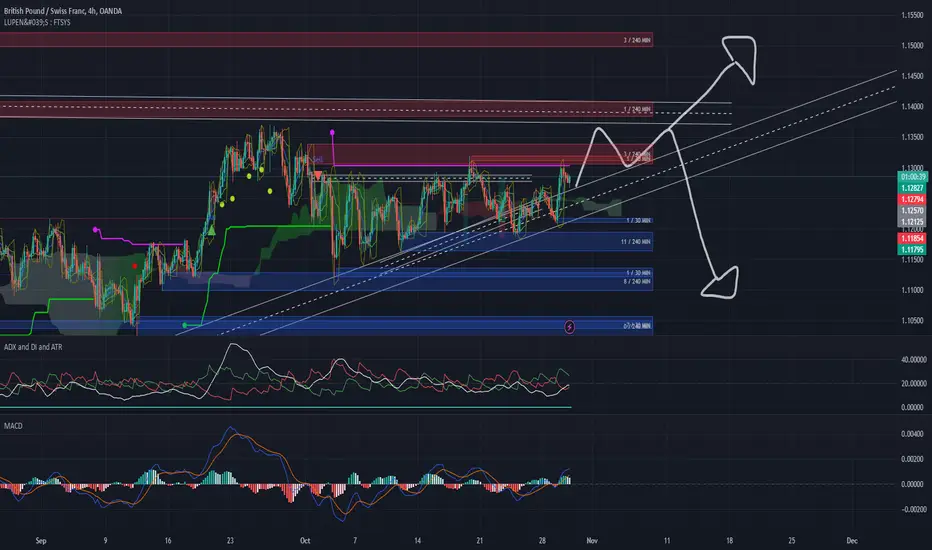
The chart price action and indicators seems to be bullish, probably because it's forming an Ascending Triangle. The overall trend appears cautiously bullish, as seen from the series of BOS and the sustained price action above key support zones. We must keep an idea at major resistance zones around 1.1300 and the 29% Fibonacci Premium level, as they may induce selling pressure.
🚀 Unlock Freemium Indicators, In-Depth Technical Analysis, and Daily Economic Insights –> Join Our Exclusive I.R.M.O.C. Community on Telegram Today! LINK BELLOW 🚀
Disclaimer
The information and publications are not meant to be, and do not constitute, financial, investment, trading, or other types of advice or recommendations supplied or endorsed by TradingView. Read more in the Terms of Use.