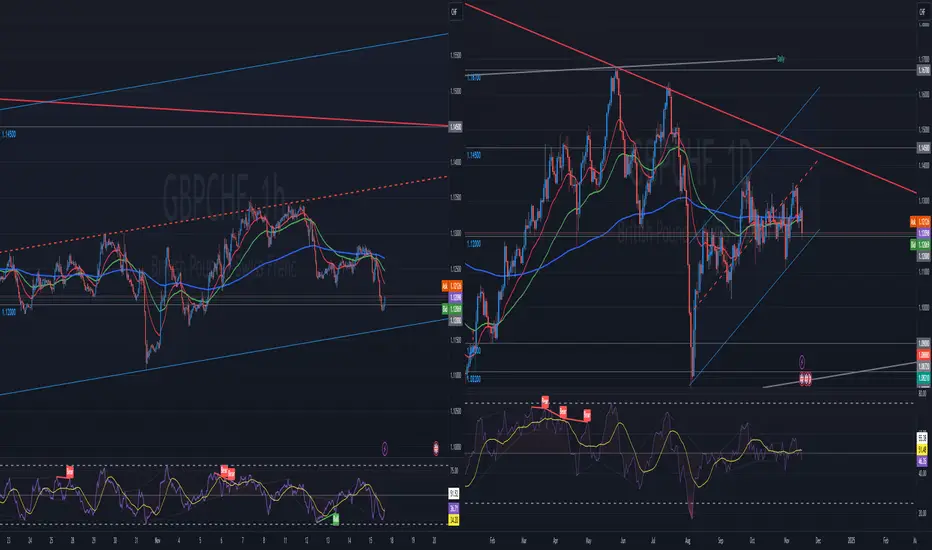
On Monthly, it's going sideway in the past 4 months or so. Price is dancing around 1.1200 Psychological SUpport as the long term shows Bearish movement for the past years.
Weekly chart doesn't add any more data.
On Daily, seems ther is a uptrend towards Monthly Upper Bearish trendline (Red line) .
On 1H chart, 200, 50 and 20 EMA are above the price and showing Bearish move, towards the bottom Bullish trendline (Blue).
It seems overall at the high level, movement is Bearish, but short term Bullish and perhaps it may be consolidating to continue Bearish move.
Disclaimer
The information and publications are not meant to be, and do not constitute, financial, investment, trading, or other types of advice or recommendations supplied or endorsed by TradingView. Read more in the Terms of Use.
Disclaimer
The information and publications are not meant to be, and do not constitute, financial, investment, trading, or other types of advice or recommendations supplied or endorsed by TradingView. Read more in the Terms of Use.