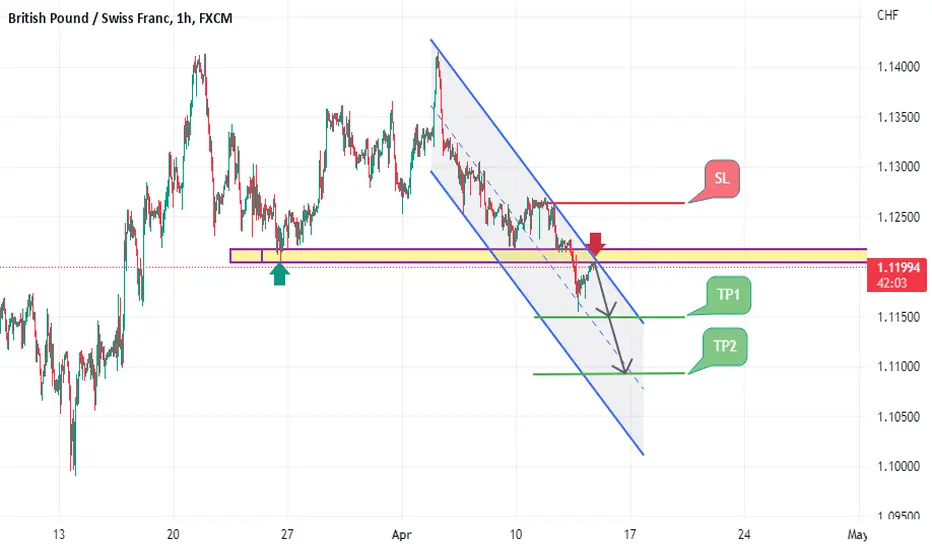
Hello traders, we want to check the GBPCHF chart on the 1-hour time frame. The price is moving in a descending channel and after breaking the support level between 1.12000 and 1.12200, it has pulled back. We expect this level to turn from a support level to a resistance level and maintain the downward trend of the price and cause the price to fall until the specified targets. Good luck.
GBPCHF sell Entry : 1.12065
Stop : 1.12630 , Target1 : 1.11500 , Target2 : 1.10920
Risk/Reward Ratio : 2
GBPCHF sell Entry : 1.12065
Stop : 1.12630 , Target1 : 1.11500 , Target2 : 1.10920
Risk/Reward Ratio : 2
Disclaimer
The information and publications are not meant to be, and do not constitute, financial, investment, trading, or other types of advice or recommendations supplied or endorsed by TradingView. Read more in the Terms of Use.
Disclaimer
The information and publications are not meant to be, and do not constitute, financial, investment, trading, or other types of advice or recommendations supplied or endorsed by TradingView. Read more in the Terms of Use.