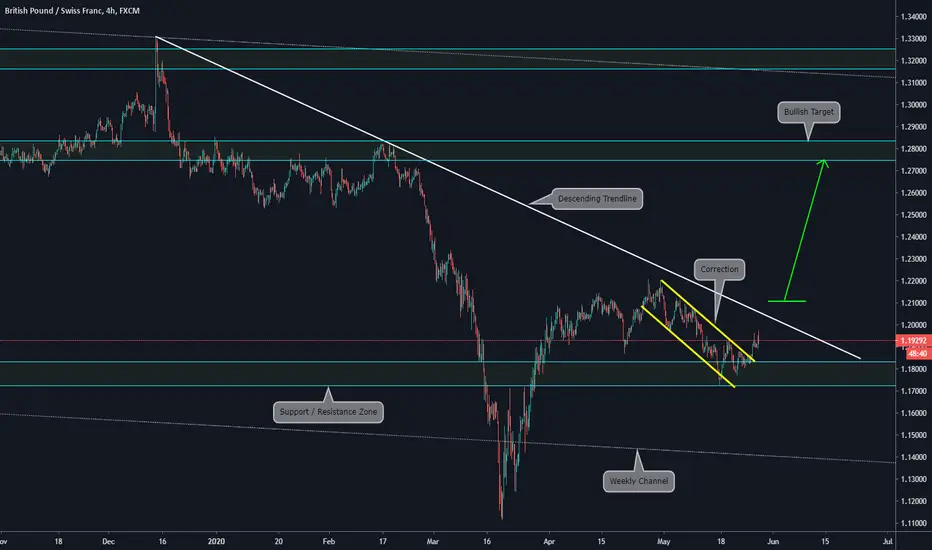
Main items we can see on the 4hs chart:
a)The price bounced with an upper movement from the lower trendline of the weekly descending channel
b)Also, the price is above a Support zone that was broken with a bearish movement
c)For the last few days the price was on a descending channel (yellow lines) making a throwback ( Test of a zone on a bullish trend) to the Support zone
d)Our expectations if the price breaks the descending trendline, is to observe a new bullish movement towards the next resistance zone at 1.28000
DAILY CHART:
Disclaimer
The information and publications are not meant to be, and do not constitute, financial, investment, trading, or other types of advice or recommendations supplied or endorsed by TradingView. Read more in the Terms of Use.
Disclaimer
The information and publications are not meant to be, and do not constitute, financial, investment, trading, or other types of advice or recommendations supplied or endorsed by TradingView. Read more in the Terms of Use.