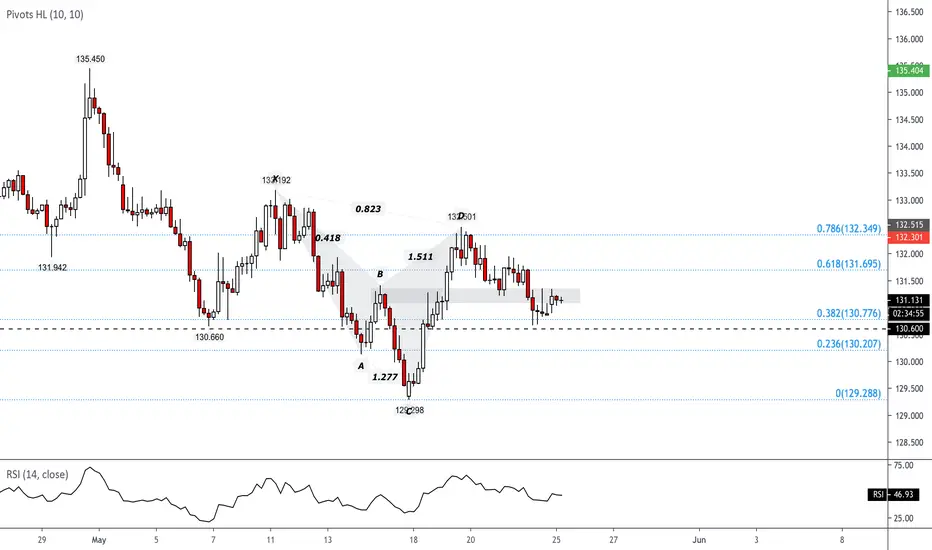
Cypher pattern appearing on GBP/JPY. RSI confirms a bearish bias, therefor short positions have been taken.
Grey highlighted box illustrates a price in which the market found both support and resistance within a relative short period of time.
Some people will say the chart looks like a Head & Shoulders, and I would agree if I did not know better. If you look on the left side on the chart, you will see that we have plenty of room to go in terms of demand which probably will end up getting filled atleast once again. We could potentially end up testing the initial support at a very psychological and major support level at 124.
Hope you enjoyed the analysis and good luck to all trading GBP/JPY!!
Note
Some more detailed added to the chart:Note
As expected, price ended up forming a double top formation after taking out previous supply. We are now set the move.. Looking to book profits en route towards next support at the 76.4% retracement, plotted as 0.236 on the chart :Note
The market retesting the cypher completion point, with the RSI showing hidden divergences:Disclaimer
The information and publications are not meant to be, and do not constitute, financial, investment, trading, or other types of advice or recommendations supplied or endorsed by TradingView. Read more in the Terms of Use.
Disclaimer
The information and publications are not meant to be, and do not constitute, financial, investment, trading, or other types of advice or recommendations supplied or endorsed by TradingView. Read more in the Terms of Use.