Detailed Techno-Macro Analysis – GBP/JPY
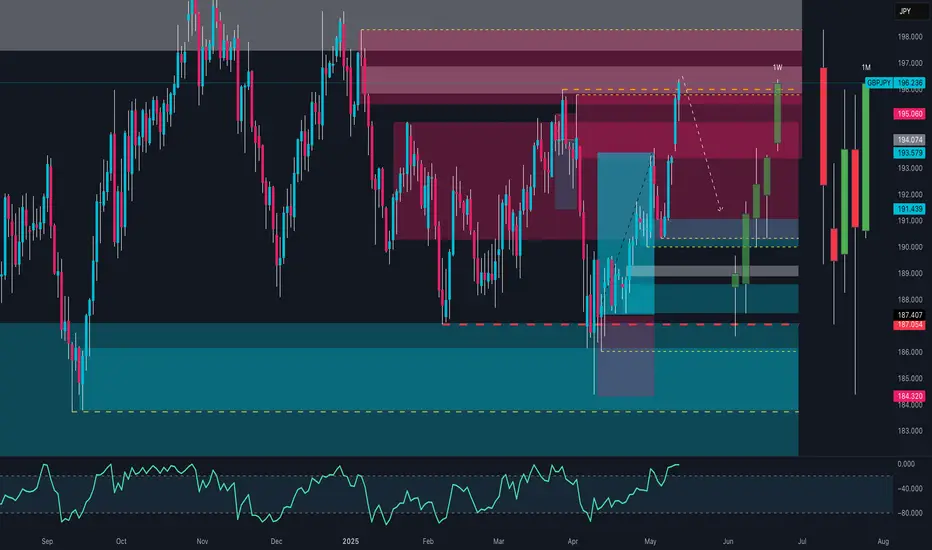
GBP/JPY has just completed a significant weekly structure breakout, pushing through a key supply zone between 195.00 and 196.30 — an area that historically acted as strong resistance. The breakout occurred via a high-volatility daily candle that closed above the zone, indicating strong bullish pressure.
🔍 Structure & Price Action
Price action shows higher lows and higher highs: a clearly defined bullish structure.
The breakout originated from an accumulation base, following a false bearish breakout below 188.50 (bull trap).
RSI is around 70 on the daily timeframe → strong momentum, but signs of potential exhaustion.
🧠 Key Zones Identified
Current weekly supply: 195.00 – 196.80 (being tested)
Next resistance: 198.70 – 199.50 (swing high and monthly level)
Immediate support: 194.00 – 192.80 (ideal area for pullback and long setups)
Structural support: 190.50 – 188.80
Invalidation: Daily close below 191.00 → potential reversal signal
📈 Macro & Fundamental Context
🇬🇧 UK Macro Update
Wages rising: +5.5% (above expectations) → could support further monetary tightening
Claimant count increasing → early weakness in the labor market
Mixed data, but wage growth bias favors GBP strength
🇯🇵 JPY Still Weak
BoJ remains ultra-accommodative
Verbal interventions from Japanese officials haven’t yet had structural impact
🪙 Retail Sentiment
70% of retail traders are short GBP/JPY, with an average price of 190.59
Only 30% are long, with an average price of 194.65
➡️ Current price (196.30) is above both → retail squeeze in play. Contrarian setup confirmed.
🧾 COT Report
GBP (Non-Commercial Speculators):
Long: +3,320 contracts
Short: -1,956 contracts
➡️ Net long positions increasing → favorable institutional exposure
JPY:
Mixed positions, with increases in both long and short → institutional neutrality on the yen
📅 Seasonality – GBP/JPY
May is historically bearish on both 5Y and 20Y timeframes:
5Y: -2.52%
20Y: -0.43%
Only the 2Y pattern shows a positive return
➡️ Negative seasonality vs. bullish technical structure → conflict worth watching
🔍 Execution Summary
The bullish breakout is strong and supported by sentiment and institutional positioning, but price is now entering a potential distribution zone, where profit-taking could increase.
👉 Main scenario: technical pullback toward 194.00–192.80 for possible long entries, targeting 198.50–199.50
👉 Alternative scenario: daily close below 191.00 → bias reversal and bearish continuation
Note
📈 Nicola | EdgeTradingJourney
Documenting my path to $1M in prop capital through real trading, discipline, and analysis.
Documenting my path to $1M in prop capital through real trading, discipline, and analysis.
Disclaimer
The information and publications are not meant to be, and do not constitute, financial, investment, trading, or other types of advice or recommendations supplied or endorsed by TradingView. Read more in the Terms of Use.