smart money concept (SMC) trading setup. Here's a breakdown of what's depicted:
🔍 Chart Overview
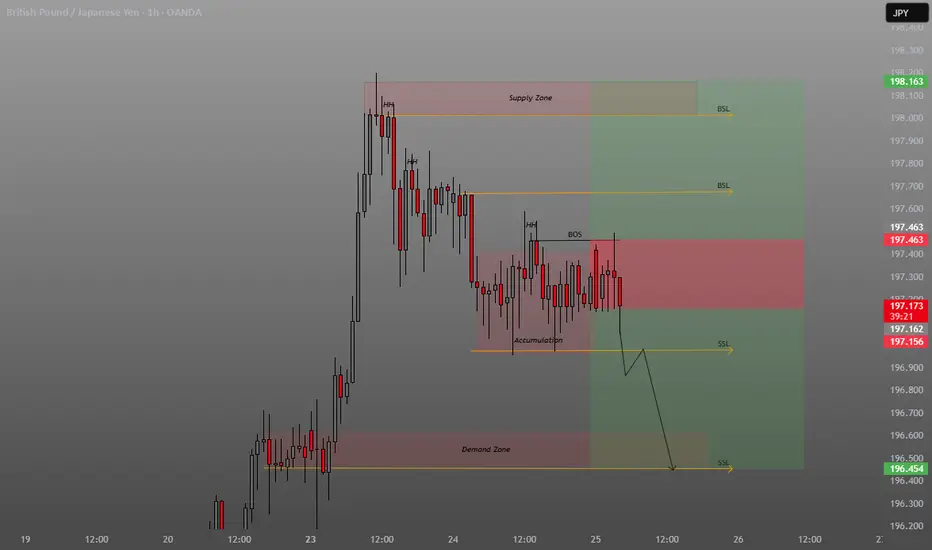
Timeframe: 1 Hour (1H)
Instrument: GBP/JPY
Analysis Date: June 25, 2025
Price at Time of Screenshot: ~197.198
📌 Key Zones and Levels
Supply Zone (Top red box near 198.163):
Indicates where institutional sellers may enter the market.
Labeled with BSL (Buy-side Liquidity) above, suggesting liquidity resting above the highs.
Demand Zone (Bottom red box near 196.454):
Represents an area where institutional buying interest is expected.
SSL (Sell-side Liquidity) is marked just below, pointing to liquidity under previous lows.
Accumulation Zone (Middle of chart):
Consolidation area suggesting potential accumulation by smart money before a possible move down.
🏷 Annotated Elements
HH (Higher High) and BOS (Break of Structure):
"HH" indicates recent local high points.
"BOS" suggests a market structure break to the downside—typically a bearish signal in SMC.
SSL & BSL (Liquidity Zones):
SSL (Sell-side Liquidity): Stops of long positions below swing lows.
BSL (Buy-side Liquidity): Stops of short positions above swing highs.
Price Projection:
Arrows show a bearish projection, expecting price to drop from the current area (~197.2) towards the SSL near 196.454, possibly hitting the demand zone.
📉 Interpretation
Bearish Bias:
After the BOS and accumulation phase, the chart anticipates a breakdown, targeting liquidity below.
Entry/Exit Zones:
Potential short entry in the red supply/accumulation area.
Targeting the green demand zone near 196.500 for a take-profit.
🔍 Chart Overview
Timeframe: 1 Hour (1H)
Instrument: GBP/JPY
Analysis Date: June 25, 2025
Price at Time of Screenshot: ~197.198
📌 Key Zones and Levels
Supply Zone (Top red box near 198.163):
Indicates where institutional sellers may enter the market.
Labeled with BSL (Buy-side Liquidity) above, suggesting liquidity resting above the highs.
Demand Zone (Bottom red box near 196.454):
Represents an area where institutional buying interest is expected.
SSL (Sell-side Liquidity) is marked just below, pointing to liquidity under previous lows.
Accumulation Zone (Middle of chart):
Consolidation area suggesting potential accumulation by smart money before a possible move down.
🏷 Annotated Elements
HH (Higher High) and BOS (Break of Structure):
"HH" indicates recent local high points.
"BOS" suggests a market structure break to the downside—typically a bearish signal in SMC.
SSL & BSL (Liquidity Zones):
SSL (Sell-side Liquidity): Stops of long positions below swing lows.
BSL (Buy-side Liquidity): Stops of short positions above swing highs.
Price Projection:
Arrows show a bearish projection, expecting price to drop from the current area (~197.2) towards the SSL near 196.454, possibly hitting the demand zone.
📉 Interpretation
Bearish Bias:
After the BOS and accumulation phase, the chart anticipates a breakdown, targeting liquidity below.
Entry/Exit Zones:
Potential short entry in the red supply/accumulation area.
Targeting the green demand zone near 196.500 for a take-profit.
Disclaimer
The information and publications are not meant to be, and do not constitute, financial, investment, trading, or other types of advice or recommendations supplied or endorsed by TradingView. Read more in the Terms of Use.
Disclaimer
The information and publications are not meant to be, and do not constitute, financial, investment, trading, or other types of advice or recommendations supplied or endorsed by TradingView. Read more in the Terms of Use.